By Marcello Cherchi, MD PhD
For patients
Here are answers to some of the most common questions about caloric testing.
|
What is this test? |
Caloric testing assesses the function of part of the balance system of the inner ear. |
|
What is this test looking for? |
This test mostly looks for whether part of the balance system of the inner ear on one side is weaker than on the other side. |
|
Is this test experimental or investigational? |
This test is approved by the Food and Drug Administration. It is neither experimental nor investigational. |
|
What happens during this test? |
During this test the audiologist or technician will squirt warm and cool water (or sometimes warm and cool air) into each ear while measuring your eye movements using special goggles. |
|
Is this test uncomfortable? |
While the water or air is being squirted in your ear, you may feel dizzy. Rarely, patients become nauseated or vomit. |
|
How long does this test take? |
The test takes about an hour. |
|
Do I have to prepare for this test? |
Avoid wearing any eye makeup to this test. If possible, please avoid taking meclizine (Bonine®) or dimenhydrinate (Dramamine®) for 24 hours prior to this test. If you absolutely must take these medications in the 24 hours before this test, then please let the audiologist or technician know about it. |
|
Are there any special instructions for what to do after the test? |
There are no special instructions for what to do after this test. Some patients like to have a companion available to take them home. |
For clinicians
Practical summary
Caloric testing refers to stimulation of the external auditory canal with warm (and often also with cool) water (less commonly with air), then quantifying the induced nystagmus (if any) with oculography (either videonystagmography or electronystagmography), and comparing the responses between the two ears. This assesses the relative responsiveness of the low frequency end of the vestibular tuning spectrum of the lateral semicircular canals. A less commonly utilized component of this test, called visual fixation suppression, may help identify cerebellar lesions (particularly involving the vermis).
1. Introduction
The Hungarian otolaryngologist, Robert Barany (1867 – 1936), made observations regarding patterns of nystagmus elicited by irrigating the external auditory canal with different temperatures of water (Bárány 1907), and hypothesized that the nystagmus occurred because of temperature-induced convection currents in the semicircular canals. This work earned him the Nobel Prize in 1914 (https://www.nobelprize.org/prizes/medicine/1914/barany/facts/). While some details have changed, the fundamentals of this procedure have remained the same for caloric testing up to this day.
In simple terms, caloric testing is intended to stimulate the horizontal semicircular canal on one side, partially mimicking a rotational accelerational stimulus, thereby triggering the rotational vestibulo-ocular reflex and eliciting horizontal nystagmus. This stimulus is non-physiologic since it activates only one horizontal canal at a time (whereas head turning would necessarily activate the horizontal semicircular canals on both sides simultaneously), but this enables experimental isolation of the function of one side independently of the other, which is desirable when evaluating for asymmetry.
There are many reviews of the subject of caloric testing (Goncalves et al. 2008; Shepard and Jacobson 2016).
2. Physiology and neuroanatomy
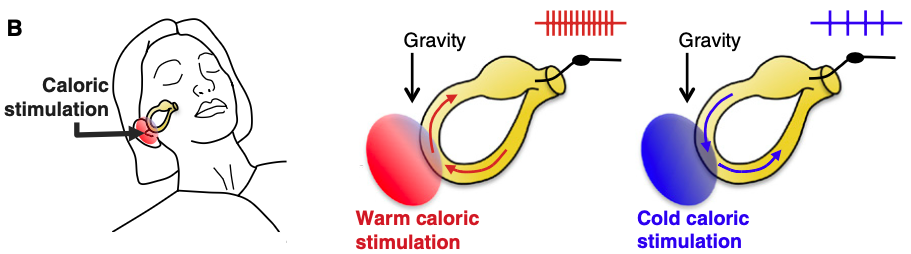
Barany (Bárány 1907) hypothesized that thermal stimulation reaching the tympanic membrane was transmitted to the semicircular canals, changing the local density of the endolymph and causing it to rise (if the stimulus was warm) or fall (if the stimulus was cool), thereby inducing a convection current in the endolymph that deflected the cupula (mechanically similar to rotational acceleration) and elicited nystagmus. This hypothesis has largely been upheld as the mechanism of the caloric response.
The schematics in the Figure, from Lopez and Blanke (Lopez and Blanke 2014), illustrate the convection currents induced by different temperature irrigations.
However, a challenge to this hypothesis comes from the fact that convection currents require the presence of gravity to work, and experiments in microgravity and zero gravity environments have shown that caloric stimulation can still elicit nystagmus (Kass et al. 1984; Kassemi et al. 2004; Kassemi et al. 2005; Scherer et al. 1986; Scherer and Clarke 1985; Stahle 1990). These observations have raised questions about whether an endolymph convection current in the semicircular canal is truly the mechanism (Kass et al. 1984; Scherer et al. 1986) underlying this phenomenon. Potential explanations for these observations include:
- Endolymph currents in the horizontal semicircular canal are induced by volume expansion rather than convection (Scherer and Clarke 1985), thereby mimicking rotational acceleration that triggers the rotational vestibulo-ocular reflex.
- Thermal transmission bypasses any endolymph activity and directly stimulates the cupula of the semicircular canal, which triggers the rotational vestibulo-ocular reflex.
- Thermal stimulation bypasses the semicircular canal entirely and instead directly stimulates the utricle, thereby eliciting the equivalent of translational acceleration (Scherer and Clarke 1985), which triggers the translational vestibulo-ocular reflex.
- Thermal stimulation may induce tonic contraction/relaxation of middle ear muscles, resulting in tonic inward or outward deviation of the stapes, thereby changing the overall endolymphatic pressure, and in turn stimulating vestibularly-sensitive structures (Bell 2019).
It is also conceivable that a combination of these mechanisms is at play (Scherer and Clarke 1985).
The mechanisms of thermal transfer through the temporal bone are incompletely characterized (Elidan et al. 1985), and almost all literature about caloric stimulation pertains to responses attributed to the horizontal semicircular canal. Whether thermal stimulation has a clinically meaningful effect on the vertical (superior and posterior) semicircular canals has been little studied. Some investigators contend that it is possible to elicit a caloric response from each of the three semicircular canals (Fetter et al. 1998), including the vertical canals (Iida et al. 1998); Aw and colleagues (Aw et al. 1998) went so far as to quantify the relative caloric responses of the canals, and concluded that in comparison to the lateral canal, “the anterior canal contributed about one-third and the posterior canal about one-tenth as much as the lateral canal did to the overall caloric response magnitude when it was reoriented from horizontal to vertical.” In contrast, other investigators reached conclusions such as, “Caloric stimulation does not reach the superior canal; therefore caloric testing cannot be used to evaluate the function of [the] superior canal” (Ichijo 2012), or “Neither posterior nor superior semicircular canal receives a caloric effect; therefore, caloric testing cannot evaluate the function of vertical semicircular canals” (Ichijo 2011). In summary, it is unclear whether caloric responses can be elicited reliably from the vertical canals, and even if one uses the optimistic proportions described by Aw and colleagues (Aw et al. 1998), caloric stimulation of the anterior canal would be equivalent to 0.001 Hz, and caloric stimulation of the posterior canal would be equivalent to 0.0003 Hz, and thus would probably not be diagnostically useful.
3. Equipment needed
The main pieces of equipment needed are (1) a videonystagmography or electronystagmography system which can perform quantitative analysis of eye movements, and (2) a caloric stimulator device.
4. How to perform the test
If there are no medical contraindications (such as otitis externa or a perforated eardrum), then:
- If a patient is very prone to nausea/vomiting, then they may be premedicated with ondansetron if there are no medical contraindications. Ondansetron does not interfere with the results of caloric testing.
- The patient is put in the supine position with the head elevated by about 30 degrees, which orients the plane of the lateral semicircular canals vertically (perpendicular to the earth’s surface).
- The patient’s eye movements are monitored by oculography (videonystagmography or electronystagmography).
- Any spontaneous (baseline) nystagmus while in the dark is noted.
- Alternating binaural (each ear) bithermal (two temperatures) caloric stimulation is performed. This consists of four sequential irrigation procedures: warm water (or air) at 44˚C, and cool water (or air) at 30˚C in each ear.
5. What this test assesses
Caloric testing assesses the function of the lateral semicircular canal (one side at a time) at the low frequency end of the vestibular tuning spectrum. As Shepard and Jacobson state, “The frequency range over which thermal caloric stimuli affect the horizontal canal is at the low end of the physiologic range that the semicircular canals can be stimulated” (Shepard and Jacobson 2016).
The raw data from caloric testing include:
- Whether there is any baseline nystagmus (prior to caloric stimulation).
- What the caloric responses are to each irrigation condition.
- The responses when the patient is instructed to fixate on a visual target during caloric stimulation.
From these data several parameters can be calculated:
- Caloric asymmetry. This provides information about whether the vestibular response from the lateral semicircular canal on one side is significantly different from that the other.
- Directional preponderance
- Gain asymmetry
- Visual fixation suppression. If visual fixation suppression failure is found, this suggests a cerebellar (particularly a vermian) lesion.
We review these below.
6. How to interpret the test results
The symmetry/asymmetry of caloric responses is usually the main interest of clinicians since there are several common disorders that can cause unilateral vestibular weakness.
Directional preponderance, gain asymmetry and visual fixation suppression, while less commonly utilized, still merit discussion.
6.1. How to interpret the vestibular symmetry/asymmetry results from caloric testing
The results from caloric testing can be analyzed in various ways (Interacoustics 2008). The main analytical methods are:
- Methods based on peak slow phase velocity:
- Butterfly diagram.
- Freyss diagram (Freyss et al. 1973; Freyss and Toupet 1978).
- Scherer diagram (Scherer et al. 1986; Scherer and Clarke 1985; Scherer et al. 1985).
- Methods based on peak nystagmus frequency:
- Claussen diagram (Claussen and von Schlachta 1972).
- Haid/Stoll diagram (Haid and Wigand 1976; Stoll 1978).
In describing these methods below, we will use the abbreviations in the following Table.
|
Irrigation of LEFT ear |
Irrigation of RIGHT ear |
|
|
WARM (44˚C) stimulation |
LW = peak SPV from left ear warm irrigation.
|
RW = peak SPV from right ear warm irrigation.
|
|
COOL (30˚C) stimulation |
LC = peak SPV from left ear cool irrigation.
|
RC = peak SPV from right ear cool irrigation.
|
Table: Nystagmus elicited by caloric stimuli. Abbreviations: SPV = slow phase velocity of nystagmus.
6.1.1. Butterfly diagram
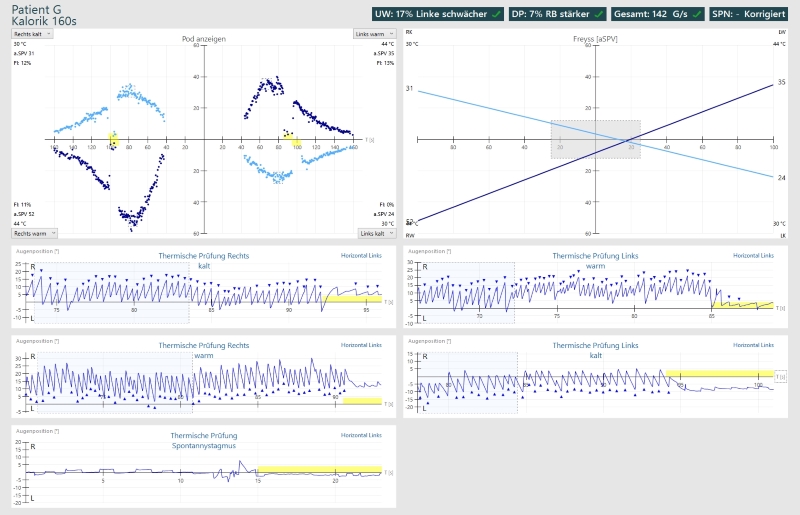
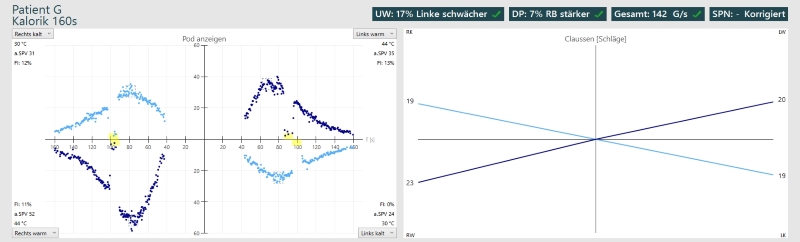
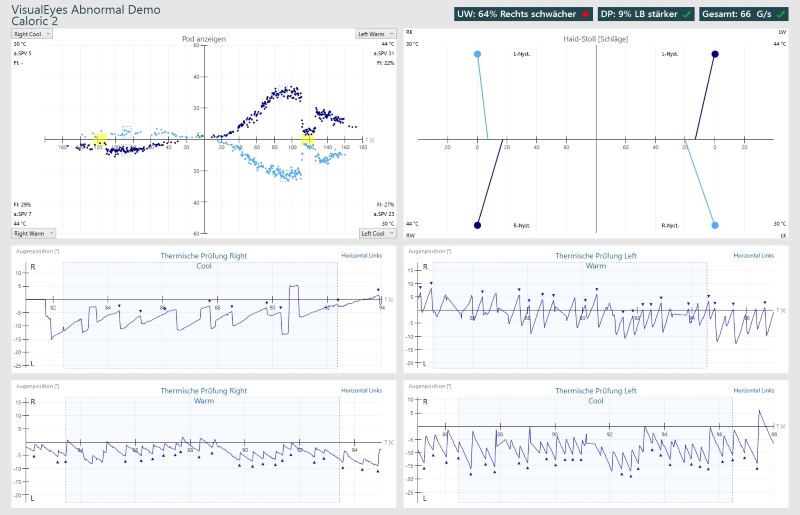
In the “butterfly diagram,” which is the most commonly used graphical presentation of caloric results, the slow phase velocities (SPV) of horizontal nystagmus in each of the four irrigation conditions are plotted over time, as shown in the Figure below (Interacoustics 2008).
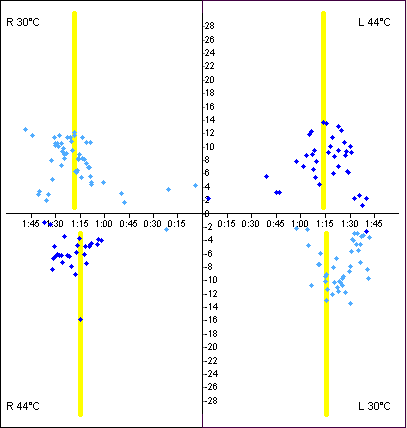
The peak SPVs from each of the four irrigation conditions are entered into the Jongkees formula (Jongkees et al. 1962):
Unilateral weakness = [ (RW + RC) — (LW + LC) ] / [ (RW + RC) + (LW + LC) ]
where:
RW = peak slow phase velocity from right ear warm irrigation (fast phase usually beats toward patient’s right)
LC = peak slow phase velocity from left ear cold irrigation (fast phase usually beats toward patient’s right)
RC = peak slow phase velocity from right ear cool irrigation (fast phase usually beats toward patient’s left)
LW = peak slow phase velocity from left ear warm irrigation (fast phase usually beats toward patient’s left)
This is the ratio of: (the difference between the total caloric responses on right side versus left side) to (the sum of all caloric responses).
Most laboratories use an upper normal limit of caloric asymmetry of 20% – 30%, though “the assumption of the normal distribution with unequal variances has not been demonstrated” (Shepard and Jacobson 2016).
There have been challenges to the utility of Jongkees formula, and suggestions for modification that take into account the order of the individual caloric stimuli (Furman and Jacob 1993), though no alternative has been widely accepted.
Results from caloric testing can be presented in other ways as well. We will review some of these other analytical methods below, even though they have not come into wide clinical use.
6.1.2. Freyss diagram
This method was developed by Dr. G. Freyss (Freyss et al. 1973). “The Freyss diagram graphically represents the average slow phase velocities (SPV) during the culmination phase of each irrigation” (Interacoustics 2008).
The Freyss diagram appears superficially similar to the Claussen diagram (see below), but in the Freyss diagram, the results of conditions that normally induce right beat nystagmus (right warm stimulation and left cool stimulation) are connected to each other, and the results of conditions that normally induce left beat nystagmus (right cool stimulation and left warm stimulation) are connected to each other; the meaningful point is where these two lines intersect, which should fall within the normative range specified by the center rectangle, as shown in the Figure below (Interacoustics 2008).
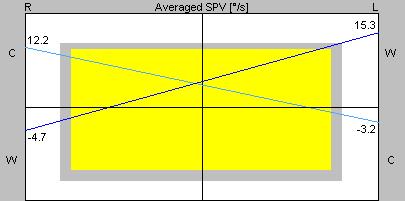
The Figure below (Diatek 2023) shows normal caloric responses (left upper quadrant) and correspondingly normal Freyss diagram (right upper quadrant).
6.1.3. Scherer diagram
This method was developed by Dr. Hans Scherer (Scherer et al. 1985). “The Scherer diagram consists of two parts: directional preponderance and unilateral weakness. In the directional preponderance graph, the average slow phase velocity right beating value is plotted versus the average slow velocity left beating value. In the unilateral weakness graph, the average slow phase velocity right ear value is plotted versus the average slow velocity left ear value” (Interacoustics 2008).
An example of a Scherer diagram is shown in the Figure below. As far as the “unilateral weakness” component is concerned, this graph plots a point whose Y‑axis value is the sum of absolute values from right ear stimulation (RW + RC) and whose X‑axis value is the sum of absolute values from left ear stimulation (LW + LC), and the user checks whether this point falls within the normative range specified on the graph.
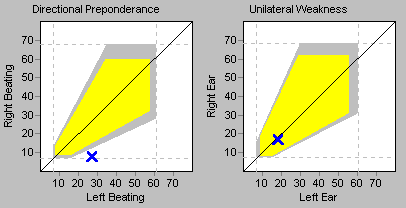
The Figure below (Diatek 2023) displays caloric results showing right-sided weakness (left upper panel), and the corresponding Scherer diagram (right upper panel).

6.1.4. Claussen diagram
This method was developed by Dr. Claus-Frenz Claussen and Dr. Irmentraud von Schlachta (Claussen and von Schlachta 1972), who also referred to it as a “butterfly chart” or “calorigram.” “The Claussen diagram gives information about the frequency of nystagmus beating during the culmination phases of each irrigation” (Interacoustics 2008).
Claussen diagrams are based on the number of beats of nystagmus in the expected direction in the 30 seconds of peak nystagmus of each of the four irrigation conditions. Note that this is based on the frequency of beats of nystagmus, not on the slow phase velocity. The Claussen diagram appears superficially similar to the Freyss diagram (see above), but in the Claussen diagram, the result from each condition is plotted along the Y‑axis in its respective quadrant, and from there a line is drawn to the origin of the graph.
An example of a normal Claussen chart is shown in the Figure below, from Chetana and Claussen (Chetana and Claussen 2010). Note that each quadrant’s result connects to the center of the graph.

Examples of various caloric pathologies in the Figure below are from Claussen and von Schlacha’s original article (Claussen and von Schlachta 1972).
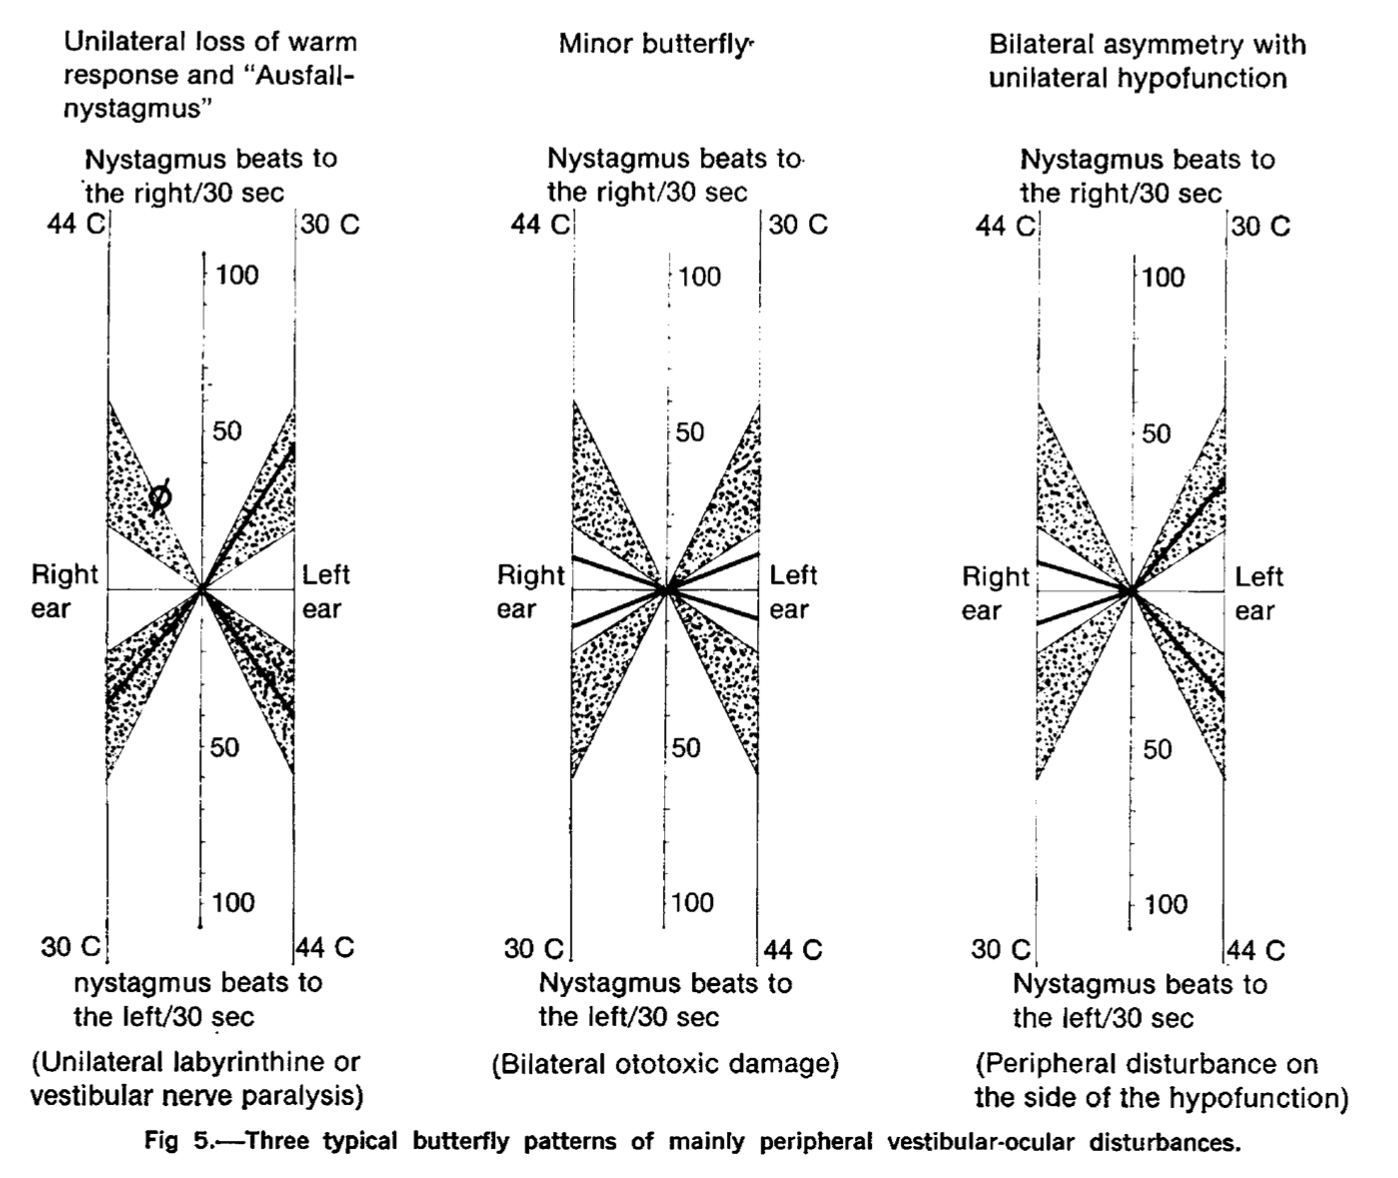
The Figure below (Diatek 2023) shows normal caloric responses (left panel) and a correspondingly normal Claussen diagram (right panel).
6.1.5. Haid/Stoll diagram
This method was developed independently by Dr. T. Haid (Haid and Wigand 1976) and Dr. W. Stoll (Stoll 1978). In the Haid/Stoll diagram, “The quadrants of the diagram represent the four caloric irrigations. Like in the Claussen diagram, the number of nystagmus beats into the non-expected direction (i.e., right in the right cold irrigation) is subtracted from the number of beats into the expected direction (i.e., left in the right cold irrigation). For each irrigation, the number of nystagmus beats is plotted on the X-Axis by drawing a line from the outside of each quadrant to the center of the diagram when the sum of beats into the expected direction minus the ones into the non-expected directions is positive, and to the outside in case there are more beats into the non- expected direction than into the expected direction.”
The values used in a Haid/Stoll diagram are explained in the Table below.
|
For right cool (RC) stimulation:
The plotted line goes from the upper left-hand corner to the X‑axis at [RCLB – RCRB]. |
For left cool (LC) stimulation:
The plotted line goes from the upper right-hand corner to the X‑axis at [LCRB – LCLB]. |
|
For right warm (RW) stimulation:
The plotted line goes from the lower right-hand corner to the X‑axis at [RWRB – RWLB]. |
For left warm (LW) stimulation:
The plotted line goes from the lower left-hand corner to the X‑axis at [LWLB – LWRB]. |
Table: Values plotted for a Haid/Stoll diagram.
An example of a Haid/Stoll diagram is given in the Figure below (Interacoustics 2008).
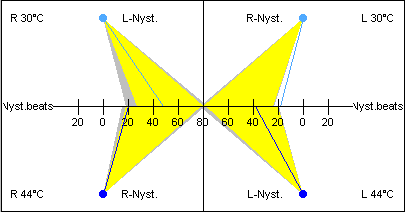
The Haid/Stoll diagram only counts beats of nystagmus over a set period of time, rather than slow phase eye velocity.
The Figure below (Diatek 2023) displays caloric testing showing right unilateral caloric weakness (left upper panel) and a corresponding Haid/Stoll diagram (right upper panel).
6.2. Directional preponderance and gain asymmetry in caloric testing
Shepard and Jacobson state:
“Two additional parameters can be obtained from the caloric analysis: DP [directional preponderance] and gain asymmetry (GA). These are both related to identifying a bias in the system that produces a stronger nystagmus response in the right-beating or left-beating direction compared to the other direction” (Shepard and Jacobson 2016).
These concepts may be clarified by reviewing the idealized butterfly plots of caloric testing in the Figures below, from Barin (Barin 2010).

Notice that in these hypothetical cases, the amplitude of the (right cool SPV + right warm SPV) responses is equal to the amplitude of the (left warm SPV + left cool SPV) responses, which means that there is no caloric asymmetry (“UW=0%”). Directional preponderance and gain asymmetry are independent of any caloric weakness.
The top panels in this Figure show directional preponderance (DP). As Barin explains:
“Caloric responses are shifted in one direction indicating presence of nystagmus at the beginning of all four irrigations. The caloric stimulus in an ear with an intact tympanic membrane does not reach the labyrinth for at least 10 seconds from the onset of the irrigation. Therefore, this baseline shift represents a pre-existing nystagmus in the standard caloric position. That is, this patient has some form of spontaneous [in this case, right beat] nystagmus. This nystagmus is added to the caloric-induced nystagmus when they are in the same direction [in this case, rightwards] and subtracted from it when they are in opposite directions [in this case, leftwards]. As a result, significant DP is generated because the peak caloric responses for two irrigations (right cool and left warm, in this case) are greater than those for the other two irrigations (right warm and left cool, in this case). This type of DP is called Bias or Baseline Shift (BS)” (Barin 2010).
In other words, in this example of directional preponderance, the spontaneous left beat nystagmus shifts the “baseline” to the left, and as a consequence, the amplitude from the shifted baseline of peak left beating SPV is equal to the amplitude from the shifted baseline of the peak right beating SPV.
The bottom panels in this Figure show gain asymmetry (GA). As Barin explains:
“The caloric responses in one direction are truly stronger than the responses in the opposite direction. There is no spontaneous nystagmus as the SPVs [slow phase velocities] at the onset of all four caloric irrigations are zero. This type of DP has been described in the literature but it is an extremely rare finding (Sills et al. 1977). Halmagyi et al. (Halmagyi et al. 2000) found this type of DP in less than 1% of patients who underwent vestibular testing whereas BS constituted the remaining 99% of the cases with clinically-significant DP. They termed this type of DP, Gain Asymmetry (GA)” (Barin 2010).
In other words, in this example, gain asymmetry is biased towards the left, meaning that the caloric conditions that elicit left beat nystagmus (namely, right cool stimulation and left warm stimulation) both generate larger responses than those that elicit right beat nystagmus (namely, right warm stimulation and left cool stimulation).
6.2.1. How to interpret the results of directional preponderance from caloric testing
Shepard and Jacobson explain that:
“DP [directional preponderance is]… related to identifying a bias in the system that produces a stronger nystagmus response in the right-beating or left-beating direction compared to the other direction. The DP is, in the vast majority of cases, explained by a persistent, pre-existing, direction-fixed, spontaneous nystagmus that produces a baseline shift. In this situation the nystagmus produced by a given irrigation has the spontaneous nystagmus added to it when [the elicited nystagmus is] in the same direction, and subtracted from the response when [the elicited nystagmus is] in the opposite direction” (Shepard and Jacobson 2016).
The concept of a baseline shift due to “persistent, pre-existing, direction-fixed, spontaneous nystagmus” is discussed by Halmagyi and colleagues (Halmagyi et al. 2000) and Cartwright and colleagues (Cartwright et al. 2000).
The directional preponderance is calculated using a version of the Jongkees formula (Jongkees et al. 1962):
Directional preponderance = [ (RW + LC) — (RC + LW)] / [ (RW + LC) + (RC + LW) ]
where:
RW = peak slow phase velocity from right ear warm irrigation (usually beats towards
LC = peak slow phase velocity from left ear cold irrigation
RC = peak slow phase velocity from right ear cool irrigation
LW = peak slow phase velocity from left ear warm irrigation
This states that directional preponderance is the ratio of: (difference between right beating versus left beating caloric responses) to (sum of all caloric responses).
Shepard and Jacobson comment that:
“The criterion for an abnormal DP varies more widely in the literature than reduced vestibular response, ranging from 19% to 30%” (Shepard and Jacobson 2016).
The clinical significance of directional preponderance is incompletely understood. Shepard and Jacobson state that:
“The general interpretation is that an isolated DP is a nonlocalizing finding, as with spontaneous or positional nystagmus. However, to carry this one step further, if the study does not show abnormalities that could be suggestive of central vestibular system involvement… then the DP indicates a bias in response to the thermal caloric that is more likely to be of a peripheral vestibular system asymmetry that has not been compensated for centrally. If a DP is seen with indications of central vestibular system involvement, a peripheral interpretation cannot be used and the bias is rather produced by a central system lesion” (Shepard and Jacobson 2016).
6.2.2. How to interpret the results of gain asymmetry from caloric testing
The gain asymmetry (GA) is essentially a correction to the formula for directional preponderance that adjusts the terms to account for any spontaneous (baseline) nystagmus.
Shepard and Jacobson explain that:
“GA [gain asymmetry is…] related to identifying a bias in the system that produces a stronger nystagmus response in the right-beating or left-beating direction compared to the other direction” (Shepard and Jacobson 2016).
They state that the gain asymmetry is calculated as follows:
“Using the same formula for the DP% [directional preponderance], the baseline shift, if there is one, is subtracted from the nystagmus intensities in the same direction and added to the nystagmus intensities beating in the opposite direction” (Shepard and Jacobson 2016).
Given that:
- Conditions expected to elicit right beat nystagmus: RW + LC.
- Conditions expected to elicit left beat nystagmus: RC + LW.
this would mean that if there is right beat spontaneous nystagmus (RBSN), the formula would be:
Gain asymmetry in RBSN = [ (RW + LC – RBSN) — (RC + LW + RBSN)] / [ (RW + LC – RBSN) + (RC + LW + RBSN) ]
= [ (RW + LC – RBSN) (RC + LW + RBSN)] / [ (RW + LC) + (RC + LW) ]
and if there is left beat spontaneous nystagmus (LBSN), then the formula would be:
Gain asymmetry in LBSN = [ (RW + LC + LBSN) — (RC + LW – LBSN)] / [ (RW + LC + LBSN) + (RC + LW – LBSN) ]
= [ (RW + LC + LBSN) — (RC + LW – LBSN)] / [ (RW + LC) + (RC + LW) ]
As mentioned earlier, Barin (Barin 2010) states that gain asymmetry is thought to be “extremely rare” (Sills et al. 1977), occurring in <1% of cases (Halmagyi et al. 2000). The diagnostic significance of gain asymmetry is unclear.
6.3. How to interpret the results of visual fixation suppression from caloric testing
Shepard and Jacobson explain:
“Usually, at the peak of the caloric response, or shortly thereafter, the patient is asked to suppress the caloric-induced nystagmus by staring at a fixed target. The target may be as simple as the examiner’s finger, or may be an illuminated LED on the inside surface of the video goggles. If the connections between the vestibulocerebellum and the vestibular nuclei (VN) are intact, the patient should be able to suppress the nystagmus by at least 50% (Alpert, 1974). In the presence of vermian lesions no such suppression can occur. Failure of this mechanism is referred to as ‘failure of fixation suppression,’ or, ‘impaired VOR suppression’” (Shepard and Jacobson 2016).
In other words, in a healthy individual, the normal vestibulo-ocular reflex can be suppressed (overridden) by visual fixation. In some cerebellar (particularly vermian) lesions, such suppression does not occur — visual fixation fails to suppress the vestibulo-ocular reflex.
Caloric testing, which induces the vestibulo-ocular reflex by non-physiologic means (thermal stimulation of one lateral semicircular canal), can assess for such failure by instructing the patient to focus on a target during the peak of the caloric response.
7. Limitations
Shepard and Jacobson (Shepard and Jacobson 2016) discuss several limitations of caloric testing.
The first issue is that despite control of the temperature of the caloric stimulus (air or water), “there is significant variability in the response from person to person and between ears, occasionally in the same person” (Shepard and Jacobson 2016).
The second issue has to do with the lack of standardization. As Shepard and Jacobson explain:
“A further issue is the implicit assumption of a normal distribution and unequal variance of the absolute responses to caloric irrigations. This is seen in the fact that the majority of laboratories will use a fixed value of percentage difference (usually 20–30%) as a criterion for an abnormal difference between the responsiveness in the right and left ears on a given patient… To the authors’ knowledge, the assumption of the normal distribution with unequal variances has not been demonstrated” (Shepard and Jacobson 2016).
The third issue has to do with the fact that very small and very large total responses will have disproportionate effects on the calculation of any asymmetry — effectively “floor” and “ceiling” effects. As Shepard and Jacobson explain:
“By having fixed criteria and using percentage difference, one can achieve the criteria with very little difference between the ears for absolute values when dealing with slow-component velocity responses of <15°/s, yet if working with responses that are >40°/s, much larger differences in the absolute values would be required to obtain the same percentage difference criteria” (Shepard and Jacobson 2016).
In other words, at very small total caloric responses, a particular absolute difference may appear to have a large asymmetry (floor effect), whereas with a large total caloric response that same absolute difference will appear to have a small asymmetry (ceiling effect).
The fourth issue has to do with the fact that caloric testing only assesses the function of the lateral semicircular canal; its effects on other canals is negligible (Ichijo 2011).
8. Contraindications
If a patient has a tympanic membrane perforation, water caloric stimulation should not be performed.
In the presence of a tympanic membrane perforation, air caloric stimulation is technically possible, but the perforation permits the thermal stimulus to enter the middle ear space, the effects of which are variable (Shepard and Jacobson 2016), and the results become difficult to interpret.
Practically, in patients with tympanic membrane perforations, we prefer assessments that do not rely on the integrity of middle ear structures, and thus will typically turn to video head impulse testing.
Otitis externa, and recent injury of the external auditory canal or pinna, may also be contraindications to performing caloric testing.
9. Pitfalls
There are several pitfalls to consider when interpreting the results of caloric testing.
9.1. Pitfalls: the caloric is a weak stimulus
The vestibular activity (in the sense of endolymph fluid movement) induced by the thermal stimulus of caloric testing is very small, much less than the vestibular activity induced by rotational acceleration. Many articles (Fife et al. 2000; Formby and Robinson 2000; Goncalves et al. 2008; Hamid et al. 1987; Lee et al. 2016; Perez and Rama-Lopez 2003; Shepard and Jacobson 2016) state that caloric stimulation is “equivalent to 0.003 Hz” of real vestibular stimulation. What does this mean? As Shepard and Jacobson (Shepard and Jacobson 2016) explain:
“The frequency range over which thermal caloric stimuli affect the horizontal canal is at the low end of the physiologic range that the semicircular canals can be stimulated. Since the thermal stimulus is a nonphysiologic stimulus, determination of the frequency response of the horizontal canal is estimated by modeling the temporal course of the caloric response as an equivalent sinusoidal rotation” (Shepard and Jacobson 2016).
Shepard and Jacobson (Shepard and Jacobson 2016) demonstrate how this is truly calculated, as shown in the Figure below.
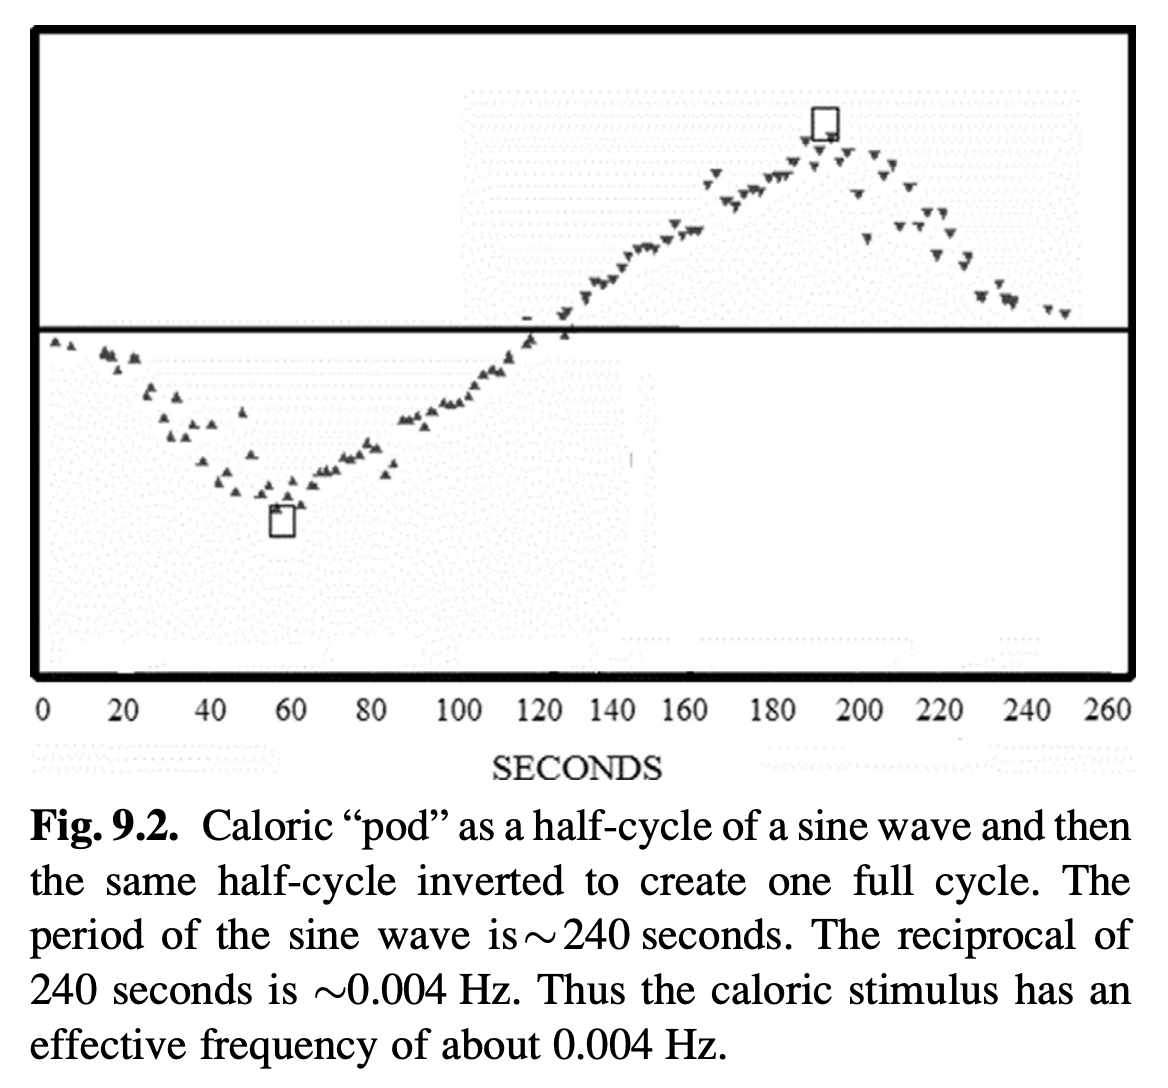
What this really means is that from these data in this patient, water caloric stimulation (acting on only one ear) can elicit nystagmus similar to what would be induced by slow harmonic acceleration at a frequency of 0.004 Hz on rotatory chair testing (which necessarily acts on both ears). Shepard and Jacobson state that, “Secondary to the individual variation in the ability of the thermal gradient to stimulate the horizontal canal, these estimates can vary from 0.003 to 0.008 Hz” (Shepard and Jacobson 2016)
Note that this weak stimulus is with water caloric stimulation. Whenever possible and safe, water caloric stimulation is preferred over air caloric stimulation, because air caloric stimulation is even weaker than water — the “thermal conductivity of air is only 0.024 W/mK, and that of water is 0.63 W/mK” (Ichijo 2011).
Since air is a relatively weak caloric stimulus, and thus elicits correspondingly weaker nystagmus, some audiology reports will conclude with a finding of “vestibular weakness,” which may not be warranted. Some audiology reports do not even specify whether water or air caloric stimulation was used, which can make it difficult to interpret the results concluding that a “caloric weakness” is present.
Since caloric weakness is calculated by Jongkees formula (Jongkees et al. 1962), one may encounter a floor effect by which small total absolute values, and thus small absolute differences, may appear to magnify the degree of caloric asymmetry. The likelihood of encountering this floor effect is greater when using air caloric stimulation.
9.2. Pitfalls: patient medications
Any centrally-acting medication has the potential to affect eye movements. From a physiologic perspective, a patient would ideally be medication-free for caloric testing. However, in practice this may not be achievable. From a medical perspective it may be risky to stop or reduce a patient’s medications. Practically, we advise patients to stop over-the-counter vestibular suppressants (meclizine, dimenhydrinate) for at least 24 hours prior to caloric testing, since stopping these medications does not run a significant risk of withdrawal.
10. When is the test indicated
Caloric testing is reasonable for a patient in whom vestibular asymmetry is suspected. Caloric testing (which assesses the low frequency end of the vestibular tuning spectrum) is particularly relevant if there is a high clinical index of suspicion for vestibular asymmetry, yet tests of the middle frequency of the vestibular tuning spectrum (such as rotatory chair testing) and the high frequency of the vestibular tuning spectrum (such as video head impulse testing) are normal.
11. Diseases that may be diagnosed by this test
The finding of caloric asymmetry may support a diagnosis of many diseases that cause unilateral vestibular weakness.
12. Additional notes
Caloric testing is often, though not always, performed in the broader context of an ocular motor test battery. This depends on the clinical query, and on the capabilities of the clinical vestibular laboratory.
References
Alpert JN (1974) Failure of fixation suppression: a pathologic effect of vision on caloric nystagmus. Neurology 24: 891-6.
Aw ST, Haslwanter T, Fetter M, Heimberger J, Todd MJ (1998) Contribution of the vertical semicircular canals to the caloric nystagmus. Acta Otolaryngol 118: 618-27. doi: 10.1080/00016489850183089
Bárány R (1907) Physiologie und Pathologie (funktions-prüfung) des Bogengang-apparates beim Menschen: klinische Studien [Physiology and pathology (functional testing) of the semicircular canal apparatus in humans: clinical studies]. Franz Deuticke, Leipzig and Vienna
Barin K (2010) Baseline shift and gain asymmetry in the caloric test. Insights in Practice for Clinical Audiology. Otometrics
Bell A (2019) What Bárány’s caloric test might have overlooked: the primary factor may be the middle ear muscles. Journal of Hearing Science 9: 9-22. doi: 10.17430/1003537
Cartwright AD, Cremer PD, Halmagyi GM, Curthoys IS (2000) Isolated directional preponderance of caloric nystagmus: II. A neural network model. Am J Otol 21: 568-72.
Chetana N, Claussen CF (2010) Vertigo in whiplash injury: A presentation of prevalent butterfly patterns of caloric tests. Indian J Otolaryngol Head Neck Surg 62: 208-14. doi: 10.1007/s12070-010-0026-4
Claussen C-F, von Schlachta I (1972) Butterfly chart for caloric nystagmus evaluation. Arch Otolaryngol 96: 371-5. doi: 10.1001/archotol.1972.00770090547015
Diatek (2023) Video-Nystagmographie und Video-Okulographie. https://www.diatec-diagnostics.ch/knowledge-base/category/vng. Accessed May 1 2023
Elidan J, Gay I, Lev S (1985) On the vertical caloric nystagmus. J Otolaryngol 14: 287-92.
Fetter M, Aw S, Haslwanter T, Heimberger J, Dichgans J (1998) Three-dimensional eye movement analysis during caloric stimulation used to test vertical semicircular canal function. Am J Otol 19: 180-7.
Fife TD, Tusa RJ, Furman JM, Zee DS, Frohman E, Baloh RW, Hain T, Goebel J, Demer J, Eviatar L (2000) Assessment: vestibular testing techniques in adults and children: report of the Therapeutics and Technology Assessment Subcommittee of the American Academy of Neurology. Neurology 55: 1431-41.
Formby C, Robinson DA (2000) Measurement of vestibular ocular reflex (VOR) time constants with a caloric step stimulus. J Vestib Res 10: 25-39.
Freyss G, de Saint-Macary M, Henin JM (1973) [Graphic presentation of the vestibular caloric test]. Ann Otolaryngol Chir Cervicofac 90: 745-61.
Freyss G, Toupet M (1978) [G. Freyss’ vestibulogram. Graphic representation of results of the unilateral bithermal vestibular caloric test]. Rev Laryngol Otol Rhinol (Bord) 99: 540-50.
Furman JM, Jacob RG (1993) Jongkees’ formula re-evaluated: order effects in the response to alternate binaural bithermal caloric stimulation using closed-loop irrigation. Acta Otolaryngol 113: 3-10. doi: 10.3109/00016489309135759
Goncalves DU, Felipe L, Lima TM (2008) Interpretation and use of caloric testing. Braz J Otorhinolaryngol 74: 440-6. doi: 10.1016/s1808-8694(15)30580-2
Haid T, Wigand ME (1976) [The frequency-calorigram an analogous representation of the caloric nystagmus reaction]. Laryngol Rhinol Otol (Stuttg) 55: 654-9.
Halmagyi GM, Cremer PD, Anderson J, Murofushi T, Curthoys IS (2000) Isolated directional preponderance of caloric nystagmus: I. Clinical significance. Am J Otol 21: 559-67.
Hamid MA, Hughes GB, Kinney SE (1987) Criteria for diagnosing bilateral vestibular dysfunction. In: Graham MD, Kemink JL (eds) The Vestibular System: Neurophysiologic and Clinical Research. Raven Press, New York, pp 115-118
Ichijo H (2011) Can caloric testing evaluate the function of vertical semicircular canals? Acta Otolaryngol 131: 716-21. doi: 10.3109/00016489.2011.554436
Ichijo H (2012) Does the superior semicircular canal receive caloric stimulation? Am J Otolaryngol 33: 718-22. doi: 10.1016/j.amjoto.2012.06.006
Iida M, Naitoh A, Aihara H, Takahashi H, Hitouji K, Nomura K (1998) Evaluation of vertical semicircular canal function by the caloric test–a study on patients with benign paroxysmal positional vertigo. Tokai J Exp Clin Med 23: 231-4.
Interacoustics (2008) VO425b – 2D-VOGfw Operation Manual. http://www.categner.se/BRUX/VN415+VO425%20Operation%20manual.pdf. Accessed May 1 2023
Jongkees LB, Maas JP, Philipszoon AJ (1962) Clinical nystagmography. A detailed study of electro-nystagmography in 341 patients with vertigo. Pract Otorhinolaryngol (Basel) 24: 65-93.
Kass J, von Baumgarten R, Benson A, Berthoz A, Brandt T, Brand U, Bruzek W, Dichgans J, Probst T, Scherer H, Vieville T, Vogel H, Wetzig J (1984) The European vestibular experiments in Spacelab-1. Adv Space Res 4: 3-9. doi: 10.1016/0273-1177(84)90217-5
Kassemi M, Deserranno D, Oas JG (2004) Effect of gravity on the caloric stimulation of the inner ear. Ann N Y Acad Sci 1027: 360-70. doi: 10.1196/annals.1324.030
Kassemi M, Oas JG, Deserranno D (2005) Fluid-structural dynamics of ground-based and microgravity caloric tests. J Vestib Res 15: 93-107.
Lee SU, Park SH, Kim HJ, Koo JW, Kim JS (2016) Normal Caloric Responses during Acute Phase of Vestibular Neuritis. J Clin Neurol 12: 301-7. doi: 10.3988/jcn.2016.12.3.301
Lopez C, Blanke O (2014) Nobel Prize centenary: Robert Barany and the vestibular system. Curr Biol 24: R1026-8. doi: 10.1016/j.cub.2014.09.067
Perez N, Rama-Lopez J (2003) Head-impulse and caloric tests in patients with dizziness. Otol Neurotol 24: 913-7.
Scherer H, Brandt U, Clarke AH, Merbold U, Parker R (1986) European vestibular experiments on the Spacelab-1 mission: 3. Caloric nystagmus in microgravity. Exp Brain Res 64: 255-63. doi: 10.1007/BF00237741
Scherer H, Clarke AH (1985) The caloric vestibular reaction in space. Physiological considerations. Acta Otolaryngol 100: 328-36. doi: 10.3109/00016488509126556
Scherer H, Clarke AH, Baetke F (1985) Überlegungen zur Physiologie der kalorischen Gleichgewichtsreaktion [Reflections on the physiology of the vestibular caloric response]. Konsequenzen aus den Ergebnissen des Weltraumexperiments in Spacelab 1 vom Dezember 1983 64: 263-268. doi: 10.1055/s-2007-1008134
Shepard NT, Jacobson GP (2016) The caloric irrigation test. Handb Clin Neurol 137: 119-31. doi: 10.1016/B978-0-444-63437-5.00009-1
Sills AW, Baloh RW, Honrubia V (1977) Caloric testing 2. results in normal subjects. Ann Otol Rhinol Laryngol Suppl 86: 7-23. doi: 10.1177/00034894770865s302
Stahle J (1990) Controversies on the caloric response: From Bárány’s Theory to Studies in Microgravity. Acta Oto-Laryngologica 109: 162-167. doi: 10.3109/00016489009107430
Stoll W (1978) [Audiogram-analogue representation of the vestibular reaction to caloric stimulation (author’s transl)]. Laryngol Rhinol Otol (Stuttg) 57: 818-23.
![]()