By Marcello Cherchi, MD PhD
The diagnosis of most otovestibular disorders relies on analysis of eye movements. For much of the clinical oculomotor examination it is desirable to avoid visual fixation suppression; this is accomplished by occluding patients’ eyes such that they feel as if they are in the dark, while the examiner continues to observe the eye movements using an infrared camera. The grayscale images acquired by infrared cameras clearly distinguish the pupil from surrounding structures, which makes it easy to observe horizontal and vertical eye movements.
Observation of torsional eye movements (rotation of the globe about the visual axis) is fairly straightforward when the iris texture (from crypts, streaks, furrows, freckles) (Edwards, Cha et al. 2016) is visible. Unfortunately, these iris features are often lost on grayscale images. This is a significant limitation because identification of torsional eye movements is crucial in the diagnosis of a number of diseases, including in the majority of cases of benign paroxysmal positional vertigo, which is the most common cause of dizziness over the lifespan (von Brevern, Radtke et al. 2007), the most common disease treated by vestibular physical therapists, and among the top 3 to 5 diseases diagnosed and managed in otoneurology and neuro-otology practices. Computerized identification of torsional eye movements has remained a significant programming challenge though there have been a number of advancements (Otero-Millan, Roberts et al. 2015). Some commercially available systems claim to track torsion, such as Interacoustics VisualEyes™ (see https://www.interacoustics.com/balance-testing-equipment/visualeyes/support/advanced-dix-hallpike, accessed 1/19/23) and the I‑PortalⓇ Falcoln™ system originally developed by Neurokinetics that was subsequently bought by Neurolign and marketed as the Dx‑100™ and Dx‑200™ systems (see https://www.neurolign.com/wp-content/uploads/2022/06/DX100-Data-Sheet-Boismier-v2.pdf, accessed 1/19/23), but these systems are expensive (in the range of $20k – $30k), so in the clinical setting, most examiners rely on direct observation.
Ophthalmologists Dr. Leonard Flom and Dr. Aran Safir were the first to be granted a patent (USPTO 4,649,349 on 2/3/1987) regarding the use of the iris for biometric identification (Flom and Safir 1987), but the practical implementation of this technique became possible thanks to the work of John Gustav Daugman (Daugman 2004, 2007), and it was quickly realized that this technique could be relevant for other applications. Computerized image processing can bring out certain patterns not evident in an original image. We have experimented with a range of image processing algorithms, and have found that contrast limiting adaptive histogram equalization (CLAHE) (Zuiderveld 1994) is usually the most effective and is easy to implement. There is already a modest literature regarding its application to iris analysis (Mat Raffei, Asmuni et al. 2015, Sajjad, Ahn et al. 2016, Kembang Hapsari, Mohammad Imam et al. 2020, Malgheet, Manshor et al. 2021), but exclusively for analyzing static images in the service of biometric identification. To our knowledge, there is no literature pertaining to its use in infrared video oculography, nor do the commercially available hardware/software packages utilize this technique as far as we are aware. Some packages permit adjustment of contrast and brightness, but these global image adjustments do little to bring out iris features.
Since commercially available hardware/software packages do not address this need, we have written software (in C++, Python and OpenCV) that we use in clinic for real-time video processing of infrared video oculography examinations.
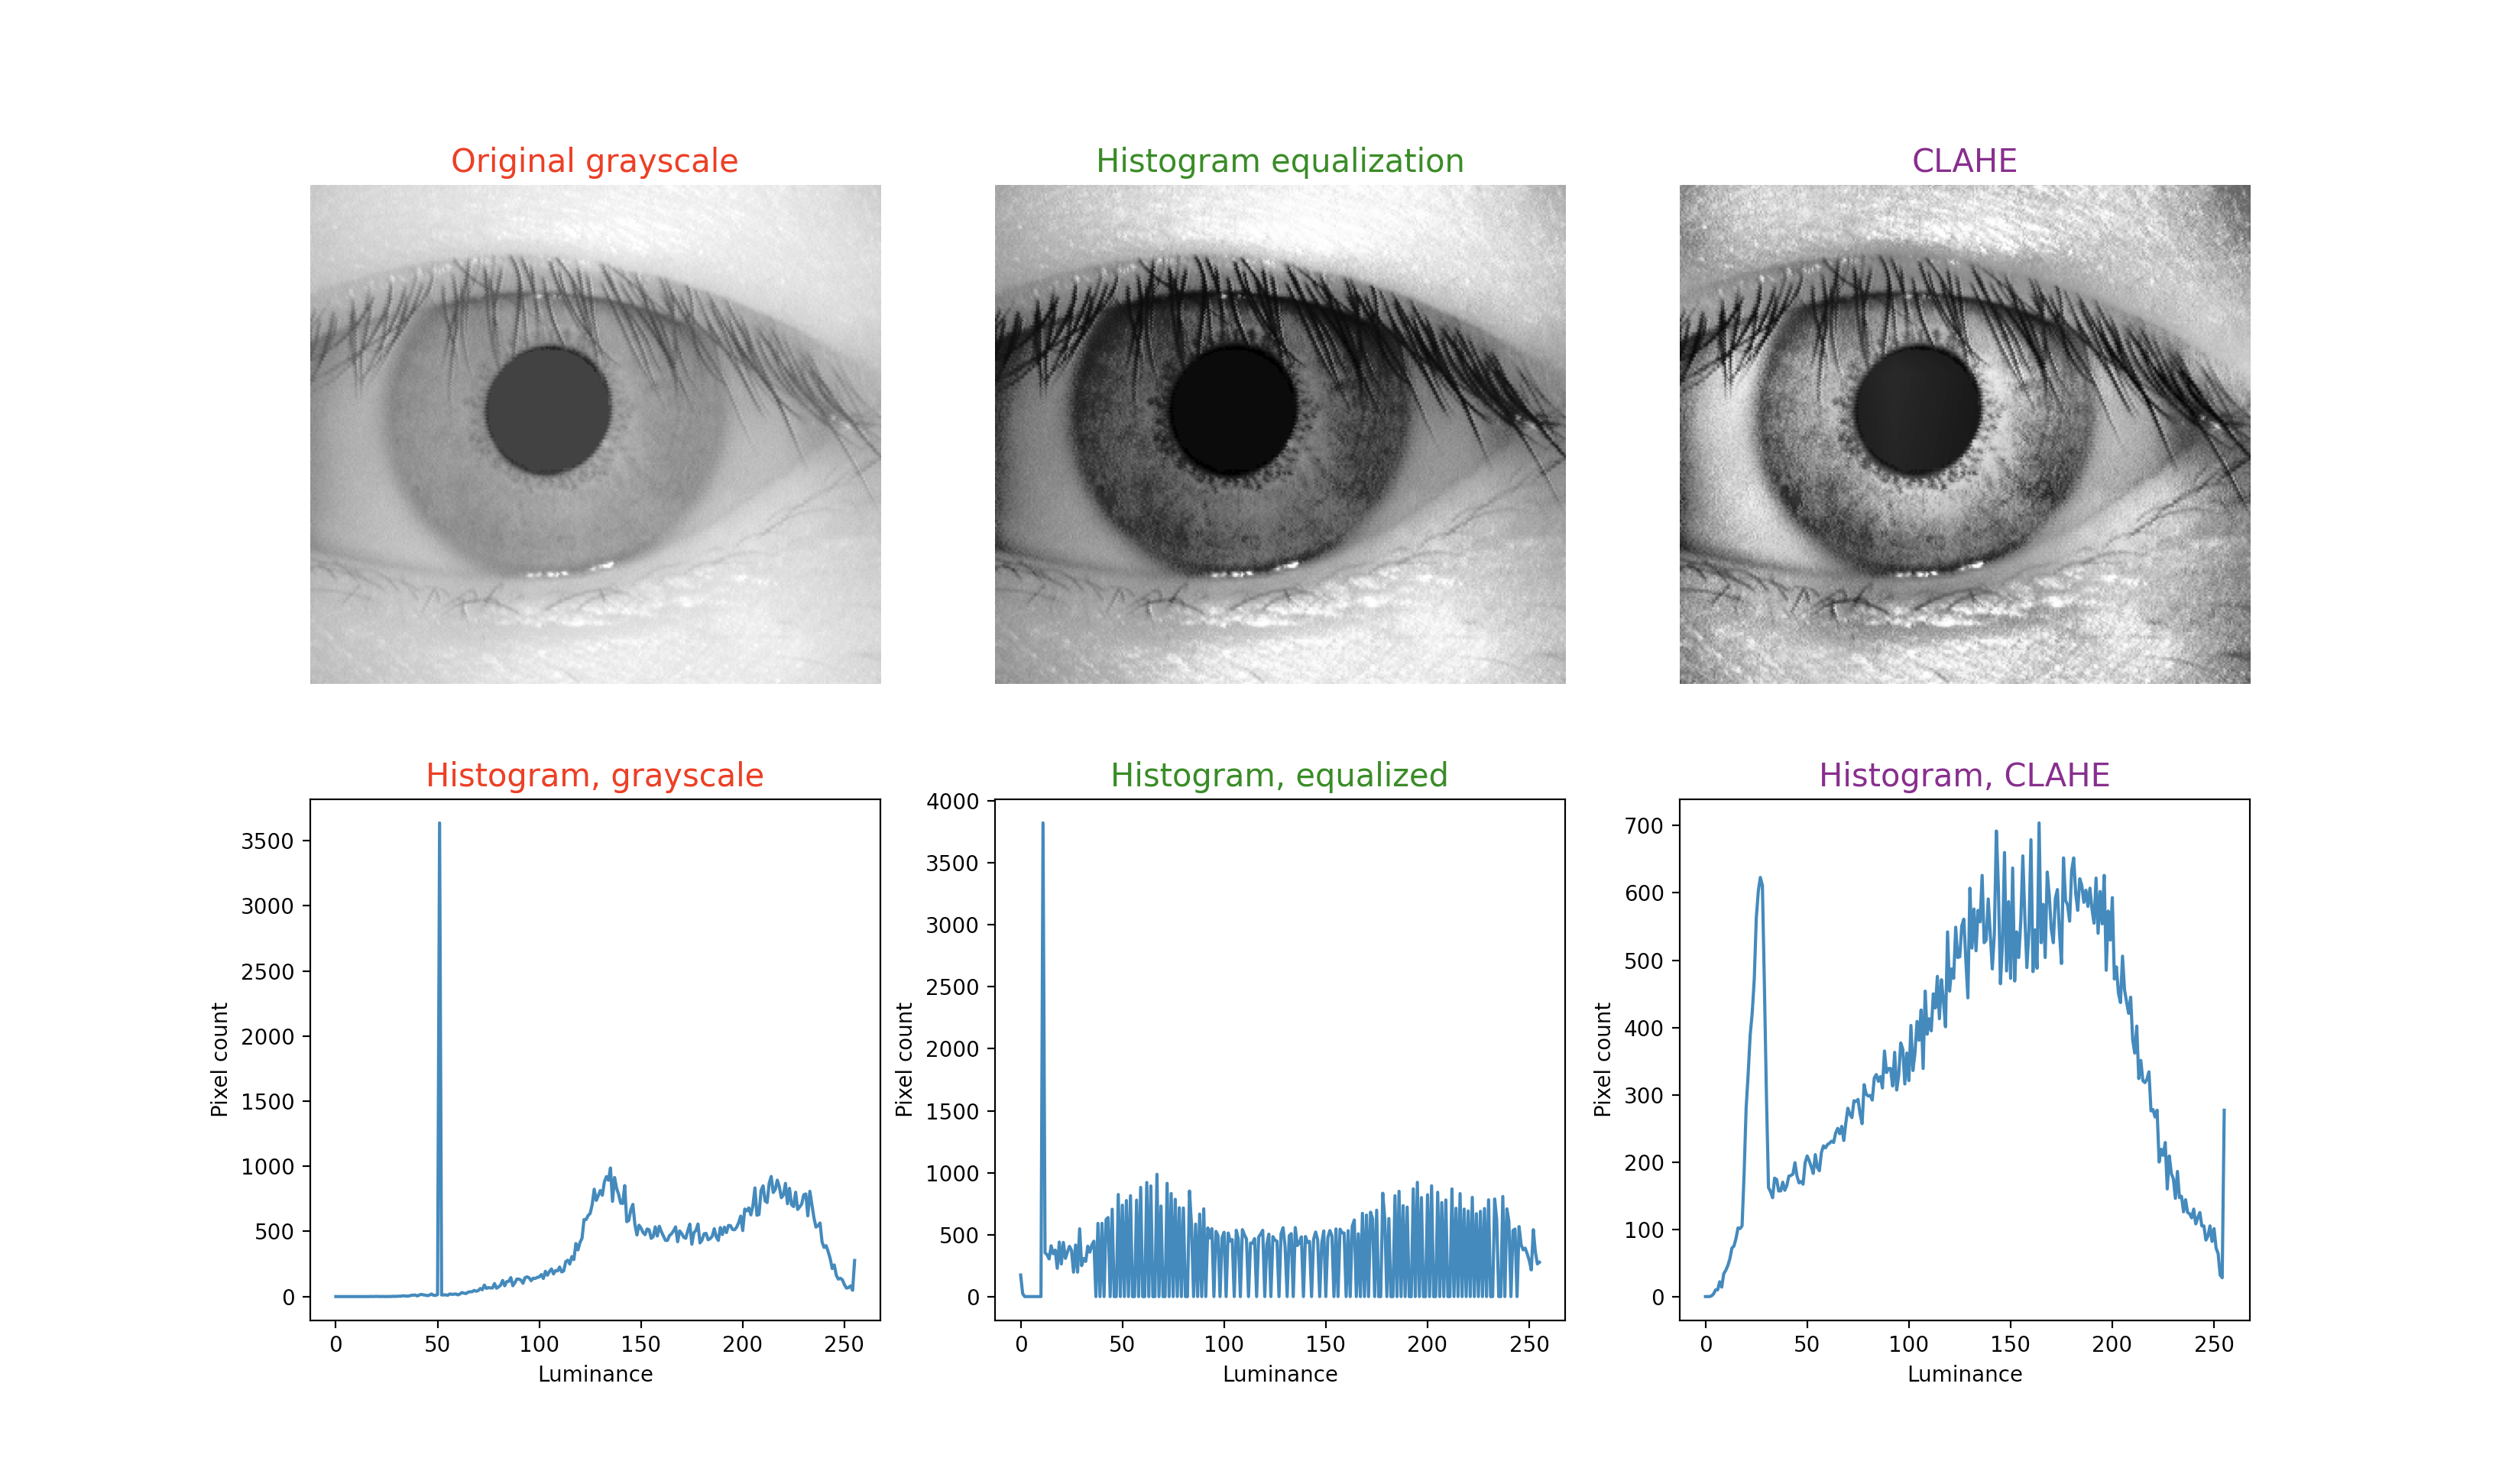
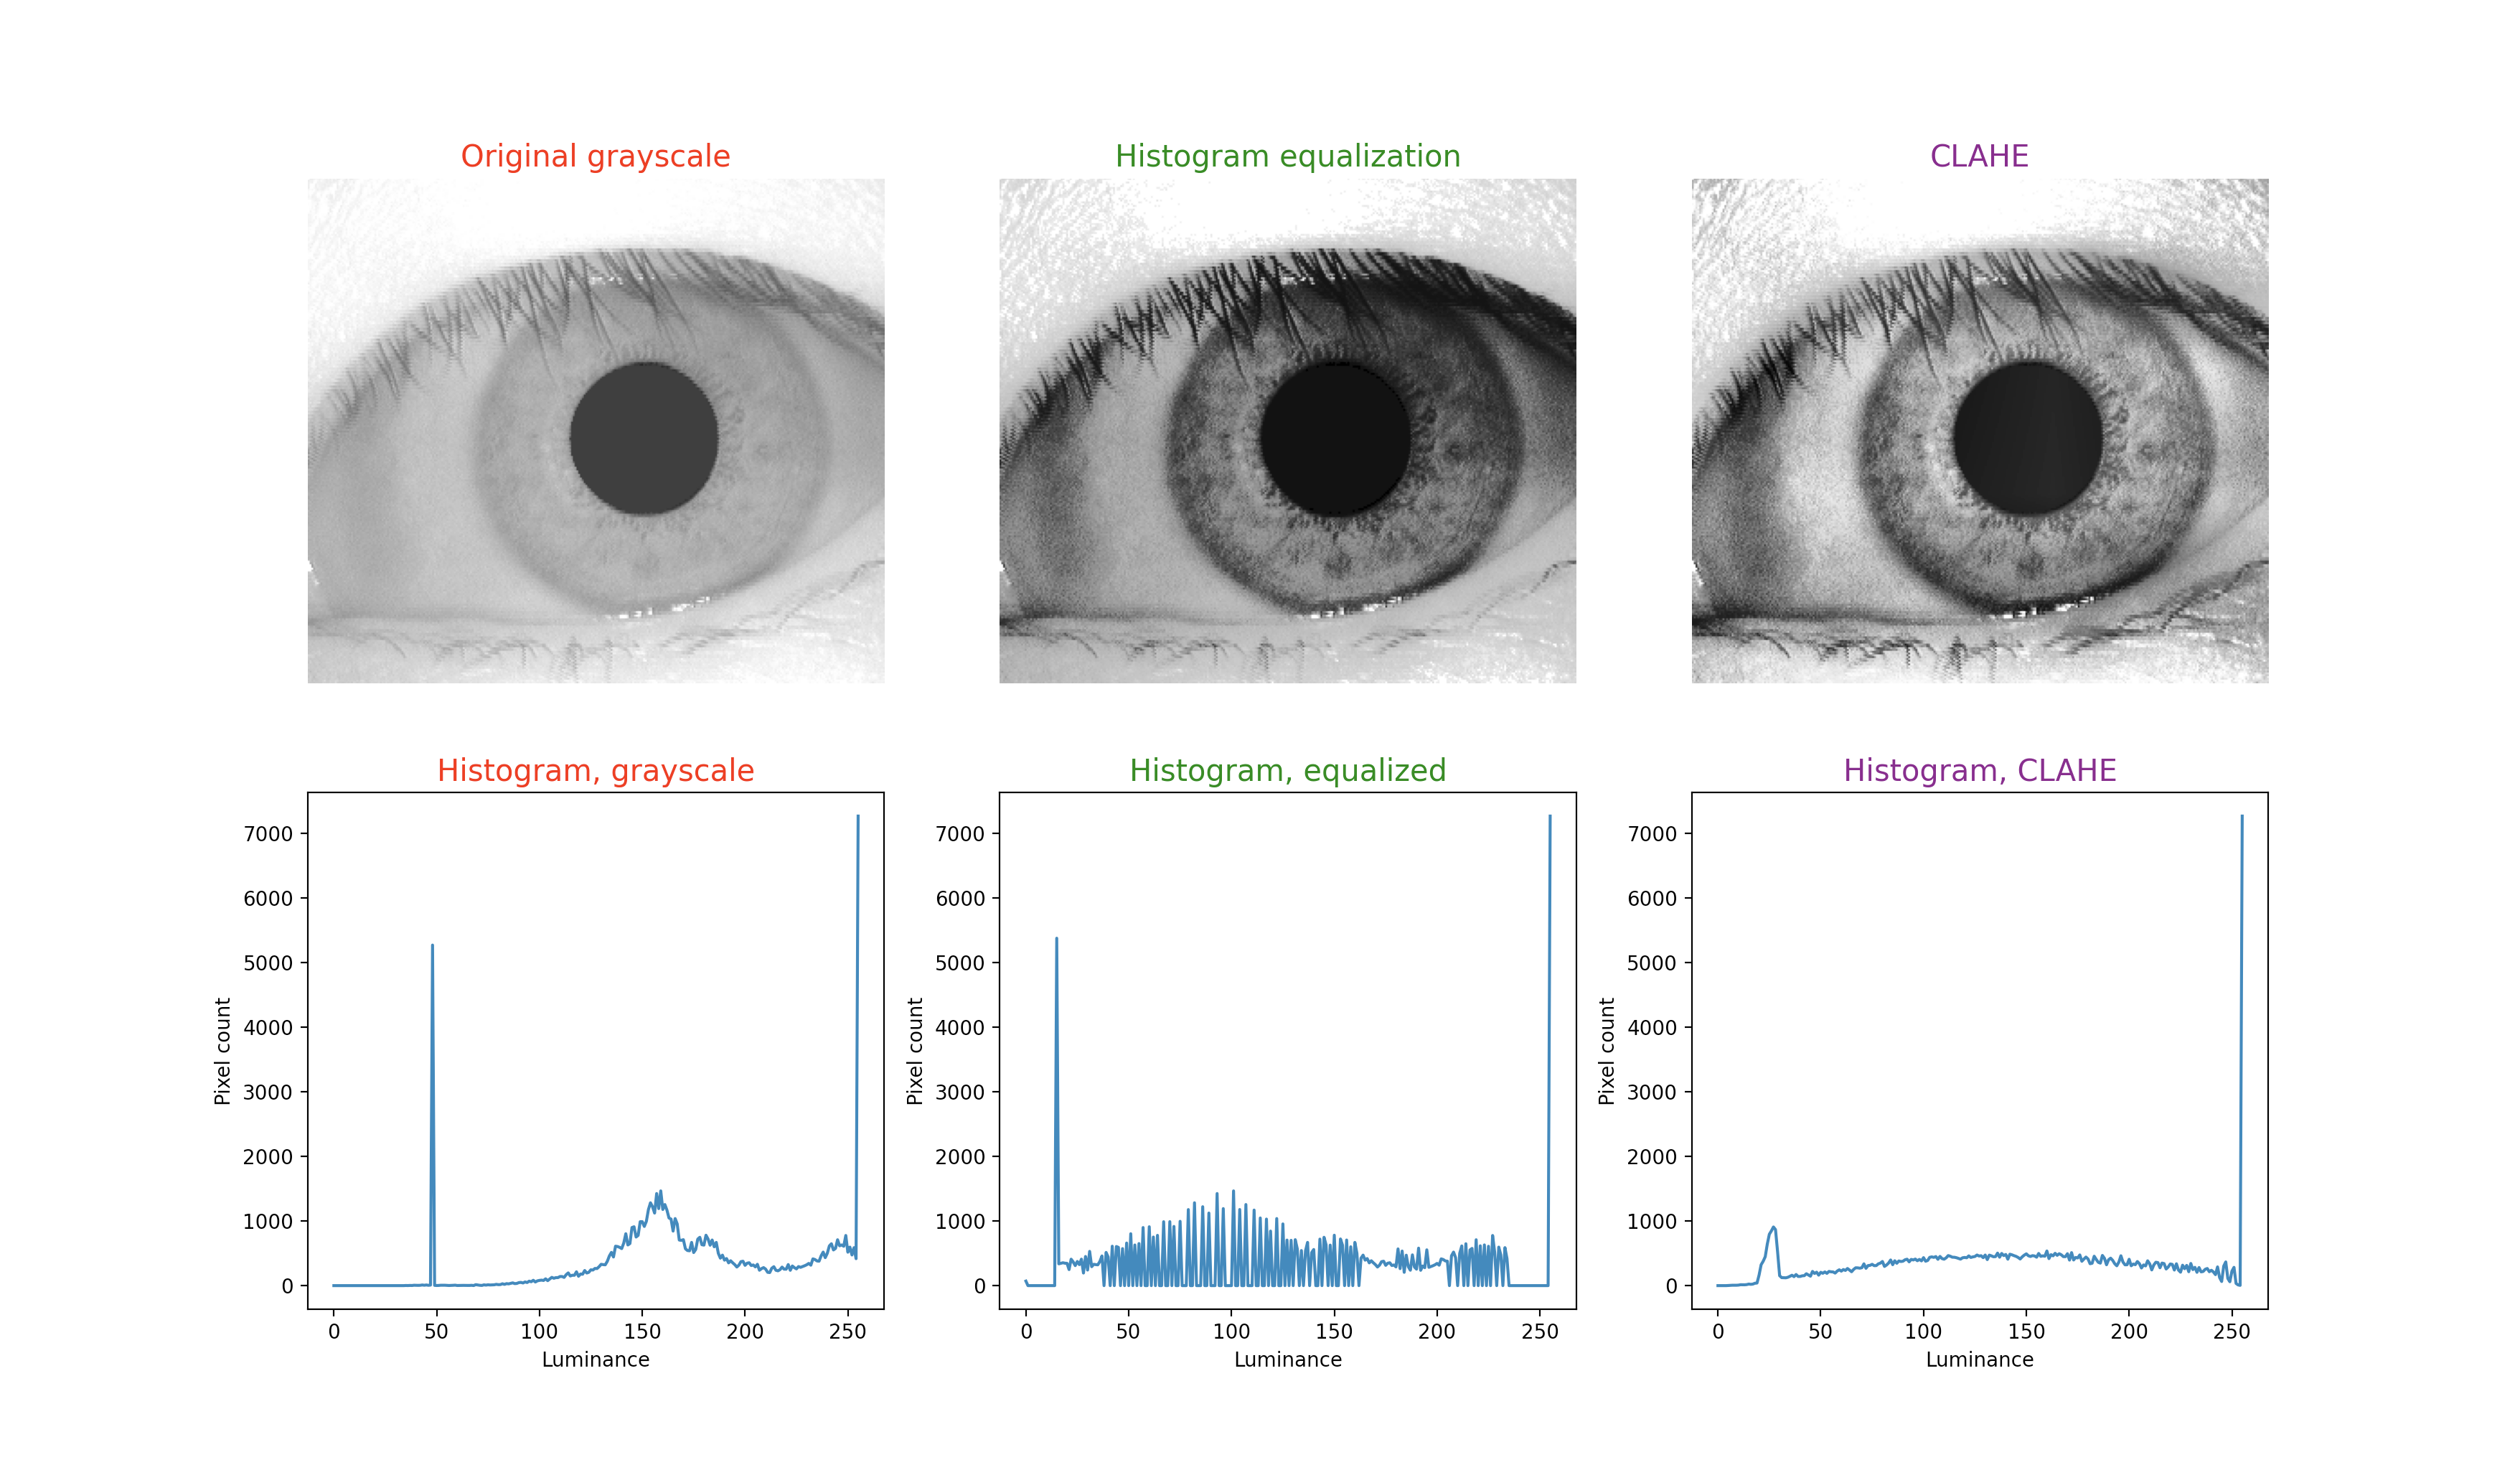
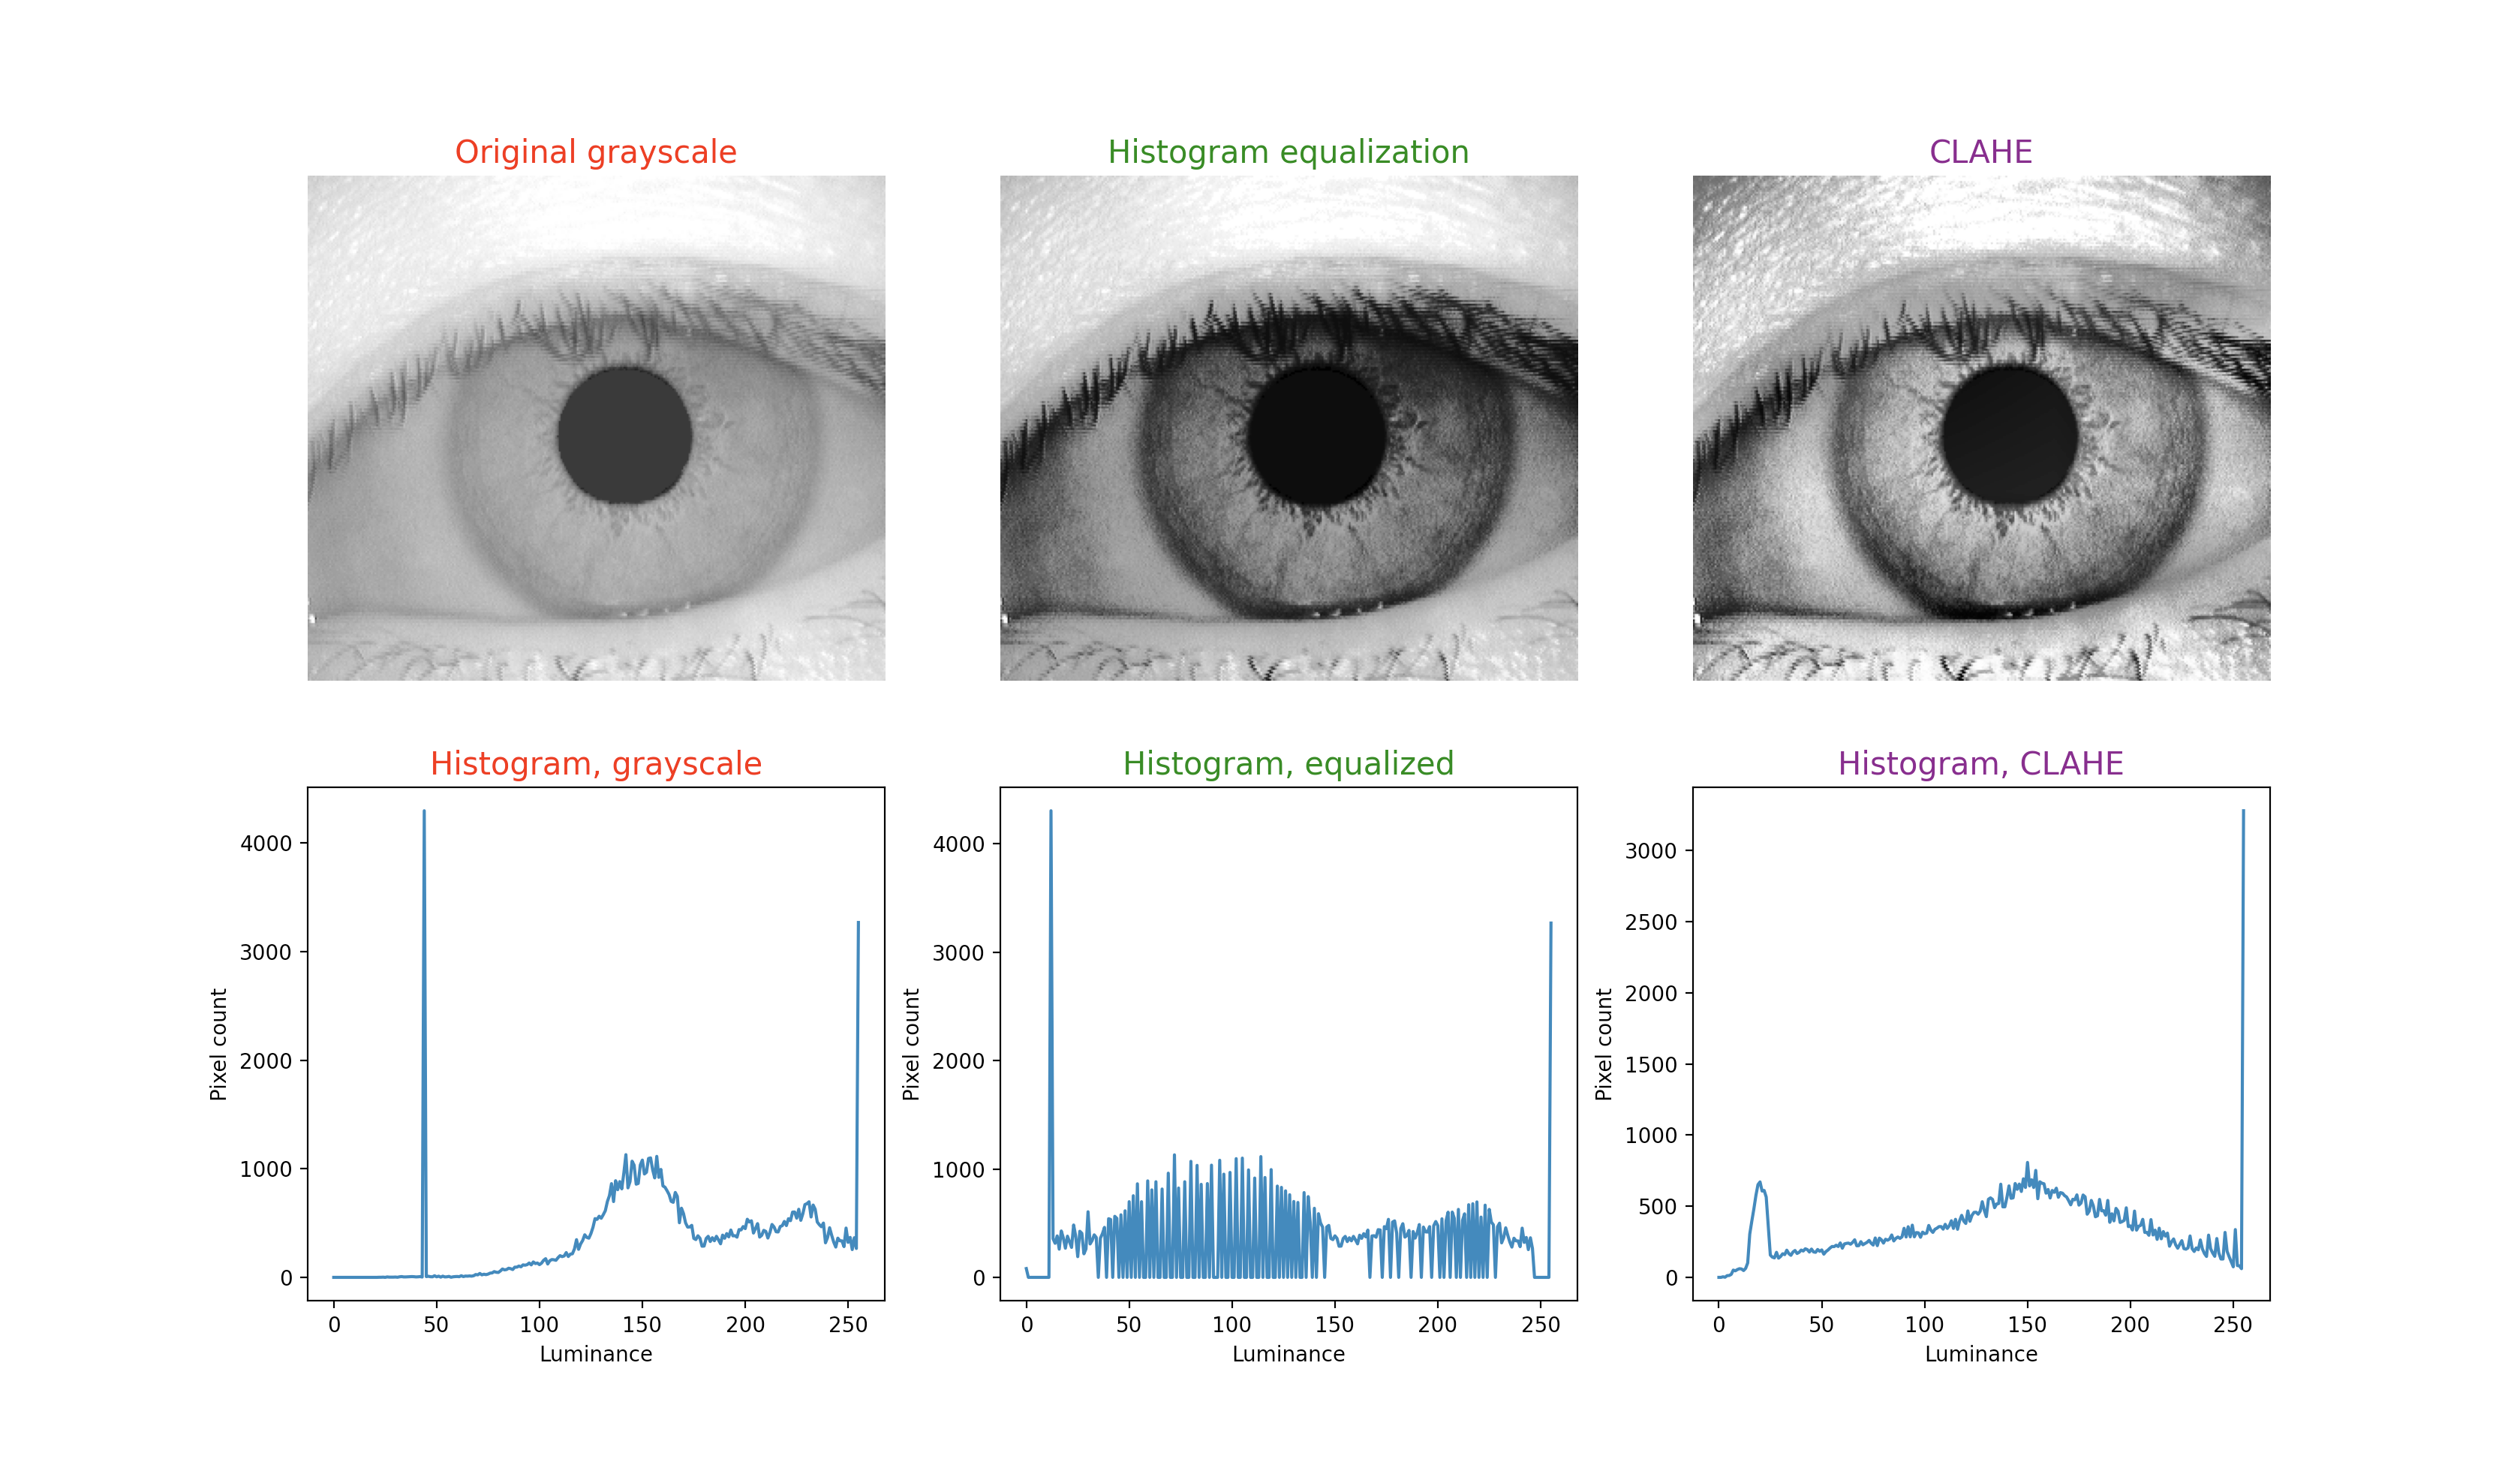
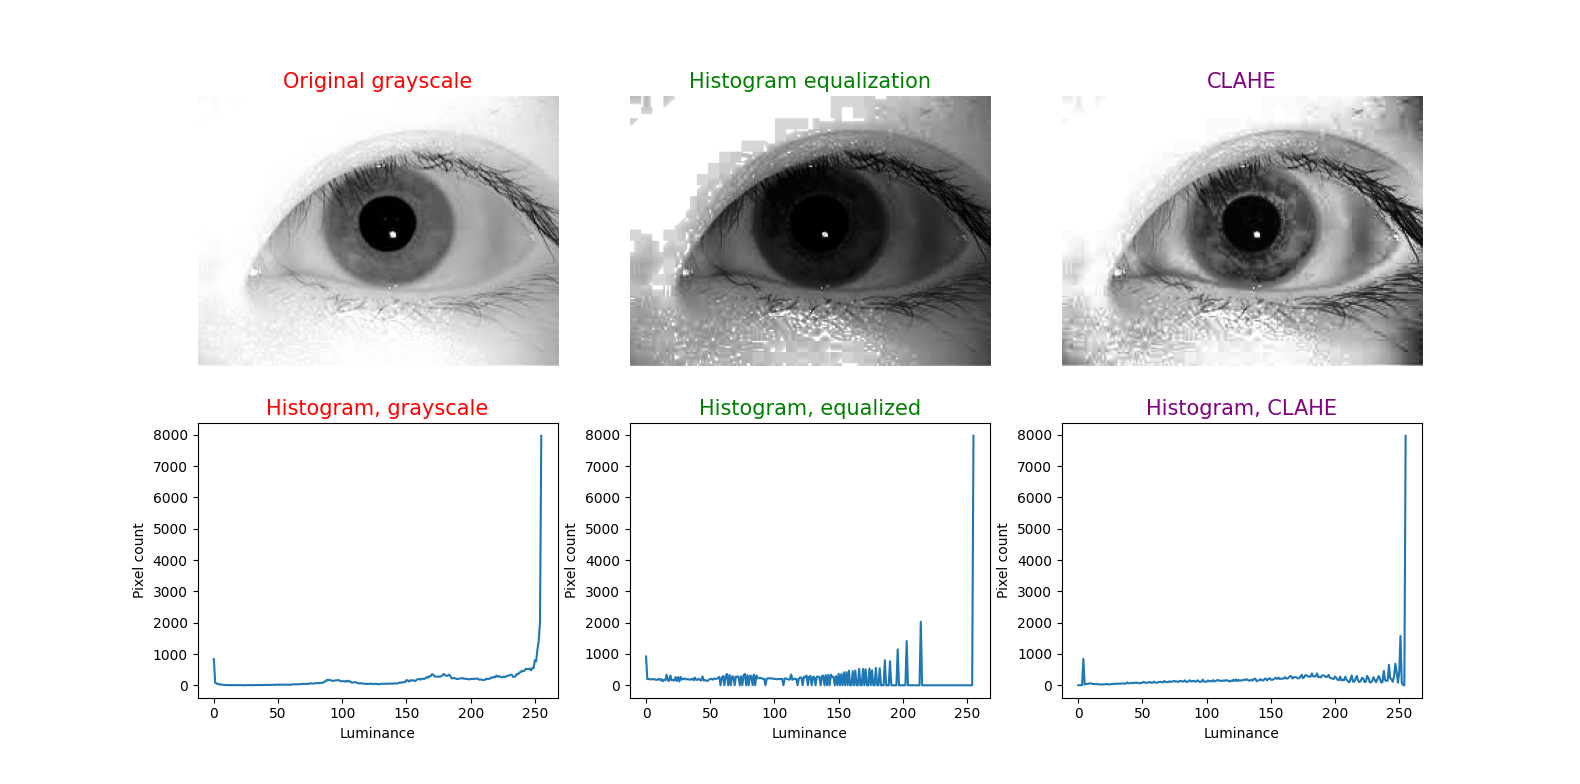
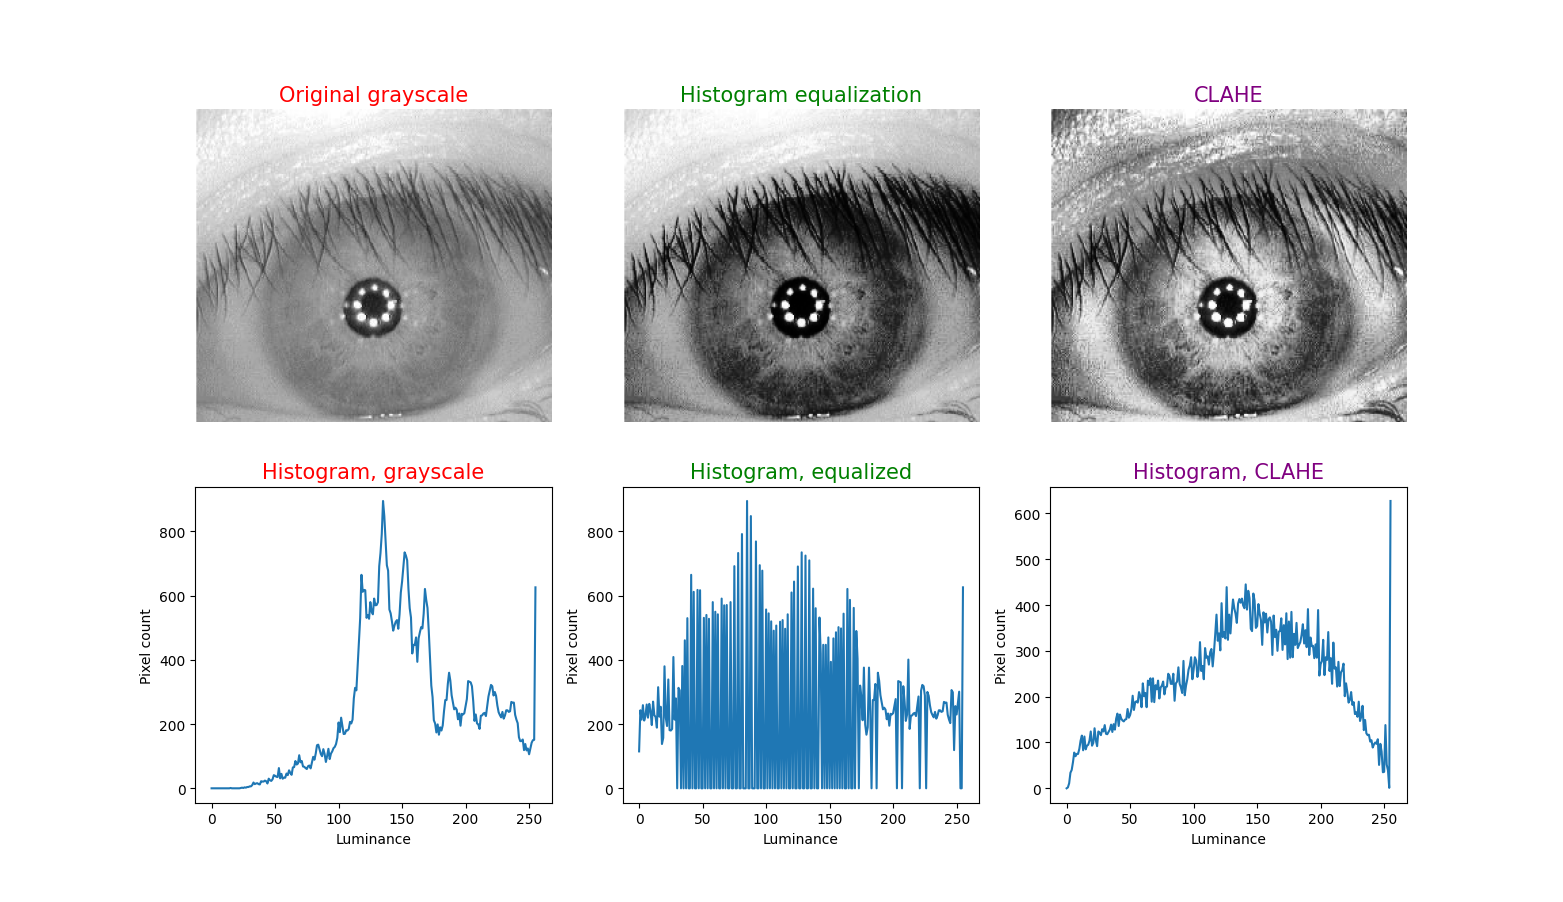
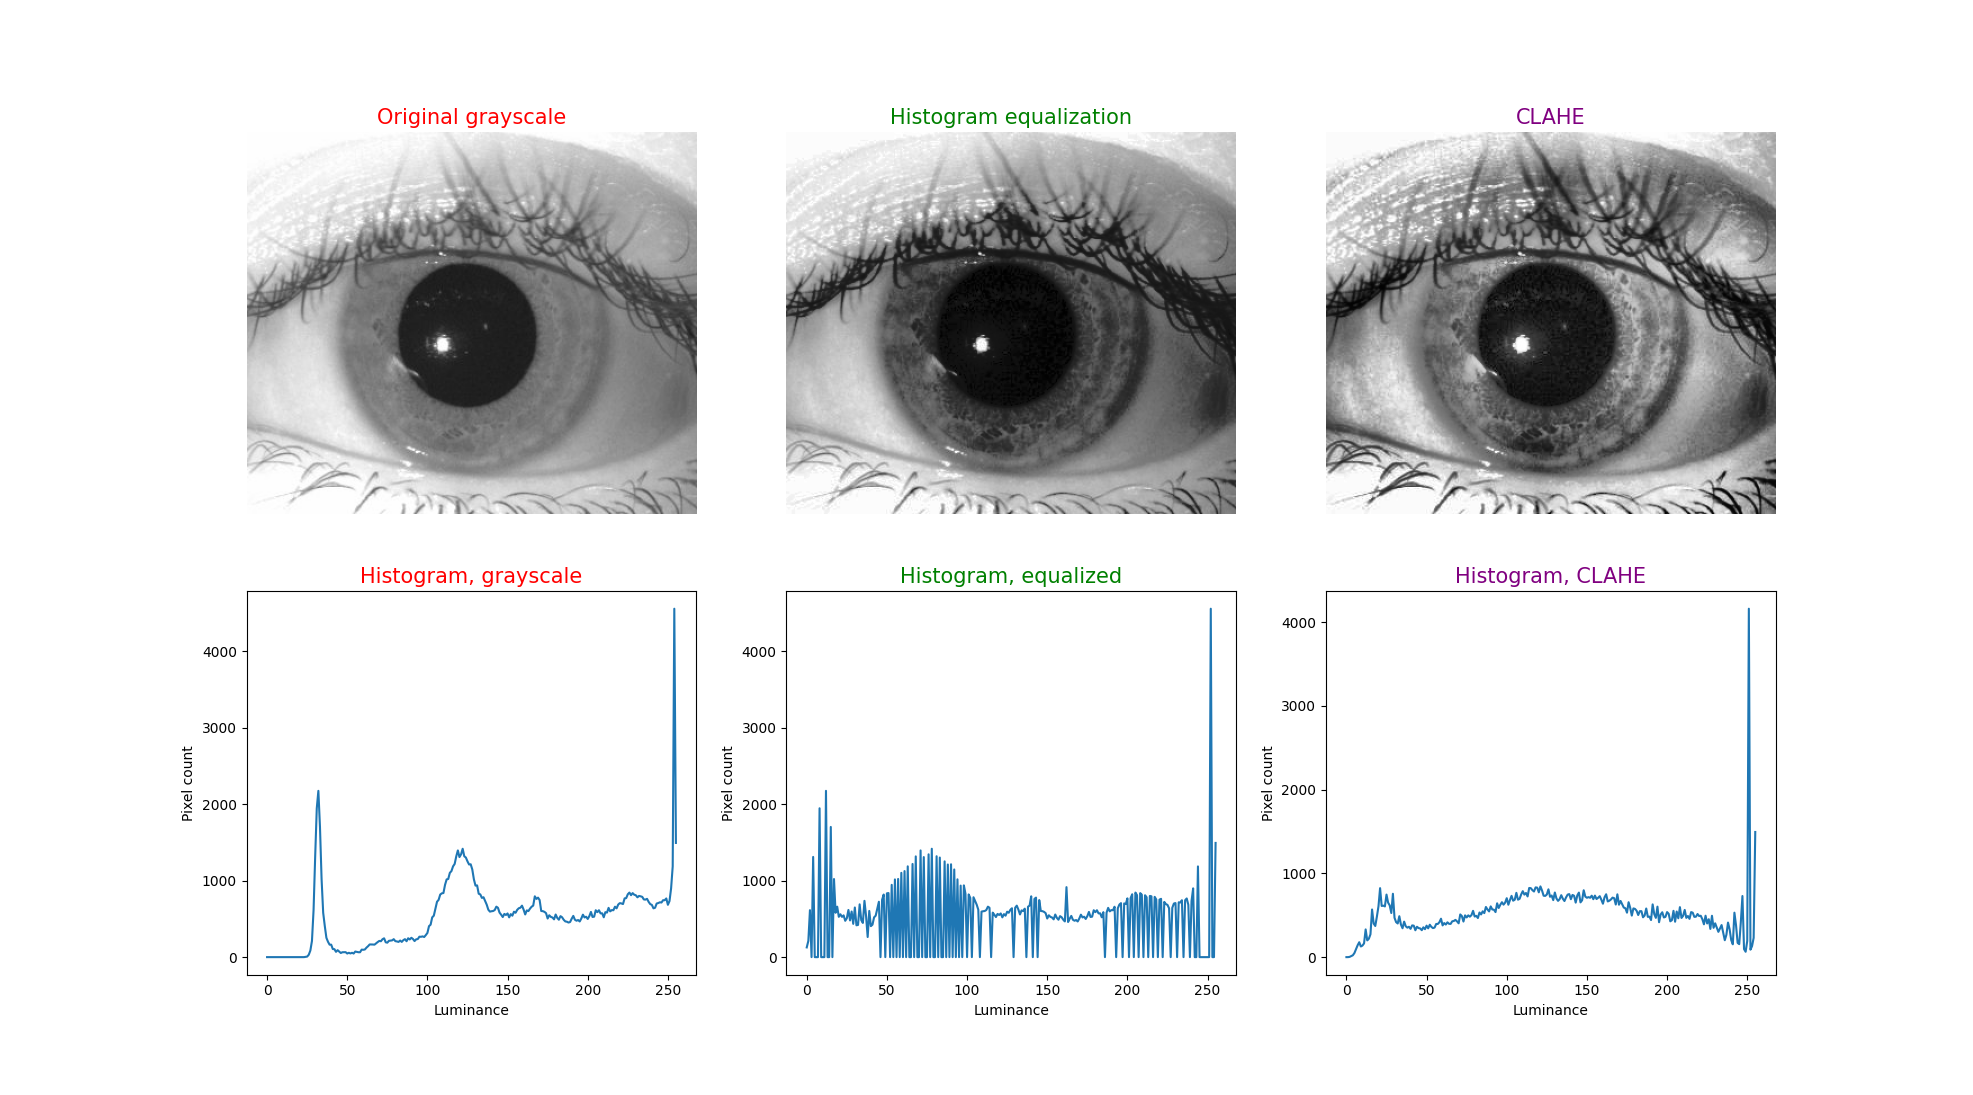
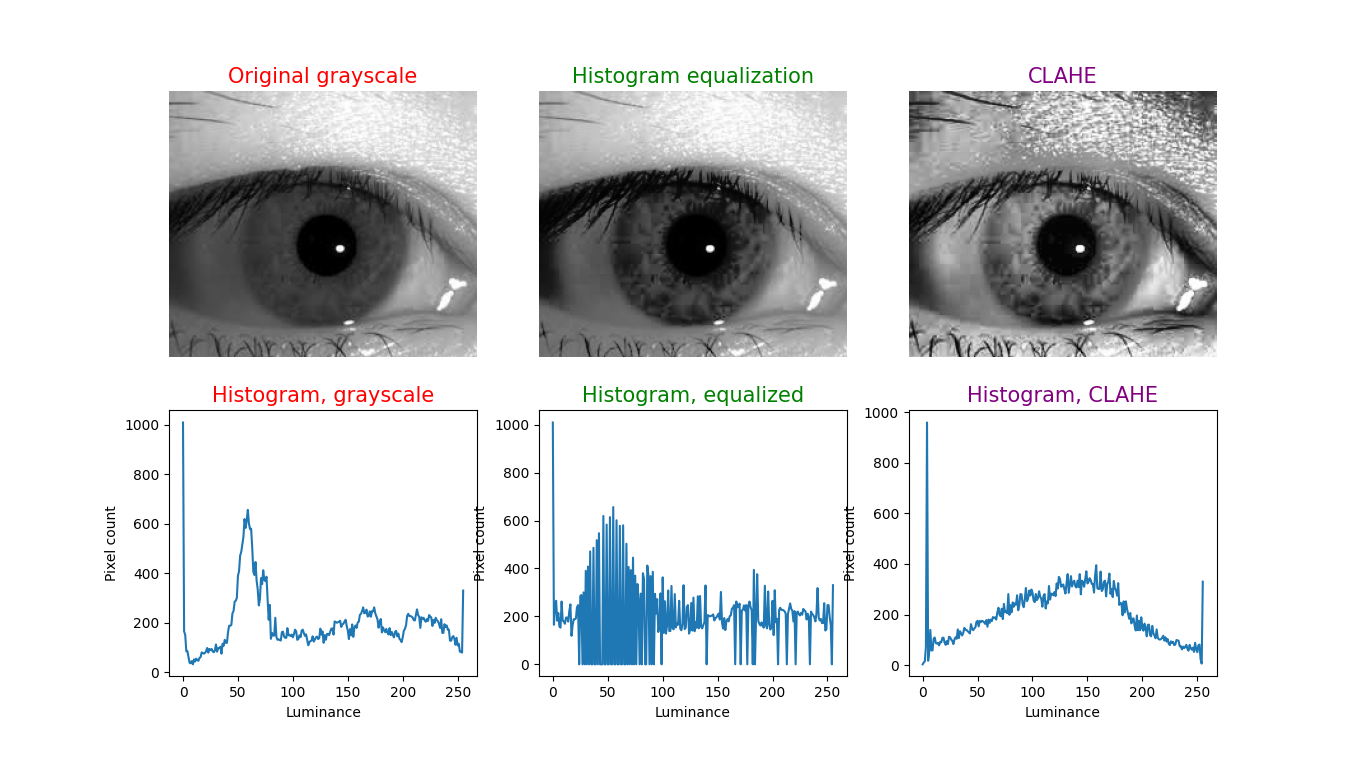
Histogram equalization (HE), also called histogram linearization, can be modified in various ways (Salem, Malik et al. 2019) and has been applied to numerous modalities and areas in medical imaging. Briefly, HE takes an image whose pixel intensities occupy a relatively narrow range and distributes those more evenly over the spectrum of intensities. One limitation is that averaging the intensities over the entire image has a dilutional effect, and can leave some image features indistinct. Adaptive (also called “local”) histogram equalization (Ketcham, Lowe et al. 1976, Hummel 1977, Pizer 1981) applies HE over small sub-regions of an image (whose dimensions are specified by the “tile size” parameter), iterating over the full image; this avoids the dilutional effect of averaging the intensities over the entire image, and thus is more likely to distinguish features within the sub-region. However, this introduces a new problem, which is that if a sub-region is fairly homogeneous in intensity, then relatively small differences of intensity within that region will be magnified — in effect making the image appear “noisy.” Adaptive HE itself can be modified in various ways (Pizer, Amburn et al. 1987), and to reduce noise, the CLAHE algorithm imposes a threshold (specified by the “clip limit” (Pizer, Austin et al. 1986, Austin and Pizer 1987) parameter) which is an upper limit cutoff for intensity differentials – this is the contrast limiting feature.
To illustrate this technique, in each figure below we have begun with an image of an iris (selected from images publicly available on the internet) whose patterns are rather indistinct, and juxtaposed that original infrared grayscale image, the HE image, and the CLAHE image, with the corresponding histogram beneath each image. These examples of static images demonstrate that the CLAHE images reveal iris patterns well.
To demonstrate the utility of this approach in identifying torsional eye movements we provide the following videos, in which we juxtapose the original (unprocessed) videos with the corresponding CLAHE videos. The original videos were acquired either with MicroMedical VisualEyes™ 505 system (Middelfart, Denmark), or with Vesticam™ (Melbourne, Australia). We have set CLAHE parameters at a tile size of 4 and clip limit of 4.
References
Austin, J. D. and S. M. Pizer (1987). A Multiprocessor Adaptive Histogram Equalization Machine. Proceedings of the Xth Information Processing in Medical Imaging International Conference, Utrecht, The Netherlands.
Daugman, J. (2004). “How iris recognition works.” IEEE Transactions on Circuits and Systems for Video Technology 14(1): 21-30.
Daugman, J. (2007). “New methods in iris recognition.” IEEE Trans Syst Man Cybern B Cybern 37(5): 1167-1175.
Edwards, M., D. Cha, S. Krithika, M. Johnson and E. J. Parra (2016). “Analysis of iris surface features in populations of diverse ancestry.” R Soc Open Sci 3(1): 150424.
Flom L, Safir A (1987) Iris recognition system. In: USPTO (ed), G06K 9/00 edn. Iridian Technologies, LLC, USA.
Hummel, R. A. (1977). “Image Enhancement by Histogram Transformation.” Computer Graphics and Image Processing 6: 184-195.
Kembang Hapsari, R., U. Mohammad Imam, R. Rulaningtyas and H. Tsm (2020). “Comparison of Histogram Based Image Enhancement Methods on Iris Images.” Journal of Physics: Conference Series 1569: 022002.
Ketcham, D. J., R. W. Lowe and J. W. Weber (1976). Real-time Image Enhancement Techniques. Seminar on Image Processing, Pacific Grove, California, Hughes Aircraft Company.
Malgheet, J. R., N. B. Manshor and L. S. Affendey (2021). “Iris Recognition Development Techniques: A Comprehensive Review.” Complexity 2021: 6641247.
Mat Raffei, A. F., H. Asmuni, R. Hassan and R. M. Othman (2015). “A low lighting or contrast ratio visible iris recognition using iso-contrast limited adaptive histogram equalization.” Knowledge-Based Systems 74: 40-48.
Otero-Millan, J., D. C. Roberts, A. Lasker, D. S. Zee and A. Kheradmand (2015). “Knowing what the brain is seeing in three dimensions: A novel, noninvasive, sensitive, accurate, and low-noise technique for measuring ocular torsion.” J Vis 15(14): 11.
Pizer, S. M. (1981). Intensity Mappings for the Display of Medical Images. Functional Mapping of Organ Systems and Other Computer Topics, Society of Nuclear Medicine.
Pizer, S. M., E. P. Amburn, J. D. Austin, R. Cromartie, A. Geselowitz, T. Greer, B. ter Haar Romeny, J. B. Zimmerman and K. Zuiderveld (1987). “Adaptive histogram equalization and its variations.” Computer vision, graphics, and image processing 39(3): 355-368.
Pizer, S. M., J. D. Austin, J. R. Perry and H. D. Safrit (1986). Adaptive Histogram Equalization for Automatic Contrast Enhancement of Medical Images. SPIE Medicine XVI / PACS IV Conference, Newport Beach, California.
Sajjad, M., C.-W. Ahn and J.-W. Jung (2016). “Iris Image Enhancement for the Recognition of Non-ideal Iris Images.” KSII Transactions on Internet and Information Systems (TIIS) 10(4): 1904-1926.
Salem, N., H. Malik and A. Shams (2019). “Medical image enhancement based on histogram algorithms.” Procedia Computer Science 163: 300-311.
von Brevern, M., A. Radtke, F. Lezius, M. Feldmann, T. Ziese, T. Lempert and H. Neuhauser (2007). “Epidemiology of benign paroxysmal positional vertigo: a population based study.” J Neurol Neurosurg Psychiatry 78(7): 710-715.
Zuiderveld, K. (1994). VIII.5. – Contrast Limited Adaptive Histogram Equalization. Graphics Gems. P. S. Heckbert, Academic Press: 474-485.
![]()